


Understanding complex system architectures requires more than just listing components. It demands a way to define how those components behave and interact within specific contexts. This is where the Profile Diagram becomes essential. Whether you are designing software systems, modeling business processes, or structuring data flows, a profile diagram provides the framework to extend standard modeling languages to fit your specific needs.
This guide breaks down the concept, structure, and creation process of profile diagrams. We will explore the core elements, review best practices, and walk through the logical steps required to build one. No specialized software knowledge is assumed. The focus remains on the underlying principles and visual logic.
What is a Profile Diagram? 🤔
A profile diagram is a specialized type of diagram used in modeling languages, such as the Unified Modeling Language (UML), to define custom extensions. Standard diagrams often cover general cases, but real-world systems have unique requirements. A profile allows you to add new concepts, called stereotypes, to the existing language without altering the language itself.
Think of it as a dictionary for your specific project. While the standard language has words like “Class” or “Interface,” a profile adds industry-specific terms like “SecureService” or “DatabaseConnection.” This keeps your documentation consistent and meaningful to your team.
Why Use Profile Diagrams? 🚀
- Customization: Adapt standard models to specific domains like finance, healthcare, or aerospace.
- Clarity: Reduce ambiguity by using terms familiar to your stakeholders.
- Reusability: Define a set of rules once and apply them across multiple projects.
- Validation: Add constraints to ensure the model adheres to specific rules or standards.
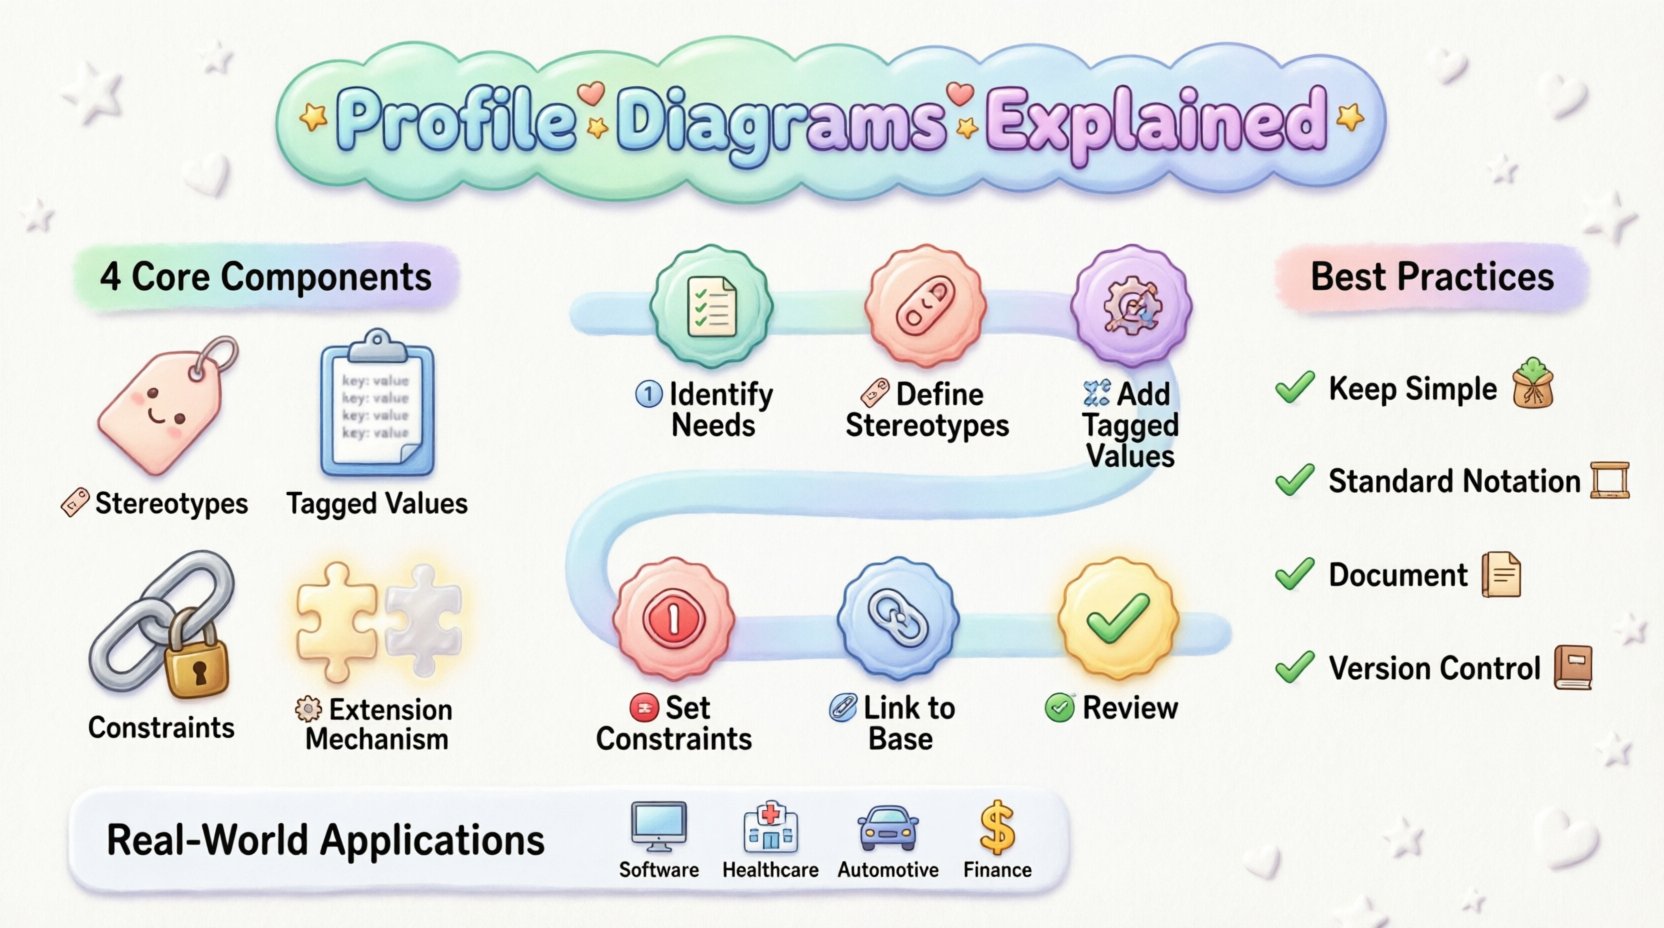
Core Components of a Profile Diagram 🔍
To build an effective profile, you must understand the building blocks. These elements work together to define new types of relationships and behaviors.
1. Stereotypes 🏷️
Stereotypes are the heart of a profile. They are new types of elements that extend existing ones. For example, you might create a stereotype called «API» that applies to a standard Class element. This tells anyone reading the diagram that this class functions specifically as an application programming interface.
2. Tagged Values 🏷️
While stereotypes define what an element is, tagged values define properties. These are pairs of key-value attributes. For instance, a tagged value might specify the version number, security level, or data retention policy for a specific component.
3. Constraints 🔗
Constraints are rules that must be followed. They limit the possible values or relationships of elements. For example, a constraint might state that a “SecureConnection” element must always link to a “Firewall” element.
4. Extension Mechanism 🧩
This is the technical link that connects your profile to the base language. It ensures that the new stereotypes are recognized as valid variations of the original elements.
Step-by-Step Guide to Creating a Profile Diagram 🛠️
Creating a profile diagram is a logical process. It involves planning, defining, and linking. Follow these steps to construct a robust profile.
Step 1: Identify the Domain Requirements 📝
Before drawing anything, understand the context. What specific needs does your system have that standard diagrams cannot address?
- Are there regulatory requirements?
- Is there a need for specific security protocols?
- Do you need to track specific performance metrics?
Write down the concepts that are missing from your current modeling vocabulary.
Step 2: Define the Stereotypes 🏷️
List the new terms you need. Group them logically. For example:
- Application Layer: Frontend, Backend, Microservice
- Data Layer: Cache, Database, LogStore
- Security Layer: AuthServer, TokenIssuer
Each of these will become a stereotype in your profile.
Step 3: Assign Tagged Values 🔢
Decide what information is necessary for each stereotype. Not every element needs a tagged value, but the critical ones do.
Example Table: Tagged Values for a «Database» Stereotype
| Key | Value Type | Description |
|---|---|---|
DBType |
String | Specifies the database engine (e.g., SQL, NoSQL) |
Region |
String | Geographic location of the data center |
Capacity |
Integer | Maximum number of records |
Step 4: Create Constraints 🛑
Define rules to maintain integrity. Constraints prevent invalid configurations.
- A
«API»element cannot exist without a«Server»element. - All
«Database»elements must have a backup defined. - Communication between layers must follow the defined protocol.
Step 5: Link to the Base Language 🔗
Connect your new definitions to the standard modeling language. This is the technical implementation phase. In a visual environment, this often involves selecting the base element (e.g., Class) and applying the stereotype (e.g., «API»). This links the visual representation to the logical definition.
Step 6: Review and Validate ✅
Once the diagram is created, review it against your requirements.
- Are all necessary concepts covered?
- Are the constraints clear?
- Is the notation consistent?
Get feedback from other modelers to ensure the profile is intuitive.
Best Practices for Clarity and Consistency 📝
A profile diagram can become cluttered if not managed well. Adhere to these guidelines to maintain quality.
Keep It Simple 🧹
Do not add stereotypes for every minor detail. Only define concepts that are used frequently or are critical to the domain. Overloading a profile makes it difficult to understand.
Use Standard Notation 📐
Stick to established visual conventions. If you use a specific shape for a stereotype, use it consistently across the entire diagram. Do not mix shapes for the same concept.
Document Everything 📖
Include a legend or a separate documentation page that explains every stereotype and tagged value. New team members need to know what «Cache» means versus «Database».
Version Control 📚
Treat your profile definition as code. If you change a stereotype or a constraint, track the change. This ensures that historical models remain valid and future models are updated correctly.
Common Pitfalls to Avoid ⚠️
Even experienced modelers make mistakes when extending a language. Be aware of these common issues.
- Ignoring Constraints: Creating stereotypes without defining rules leads to inconsistent models.
- Misusing Stereotypes: Applying a stereotype to the wrong base element. For example, applying a service stereotype to a data entity.
- Ignoring Naming Conventions: Using vague names like
«Thing»or«Object»reduces clarity. - Overcomplicating Tagged Values: Adding too many properties makes the diagram hard to read.
Real-World Applications 🏭
Profile diagrams are not just theoretical. They are used in various industries to solve specific problems.
Software Development 💻
Developers use profiles to define microservice architectures. They can specify which services are stateless, which are persistent, and how they communicate.
Healthcare Systems 🏥
Medical software requires strict adherence to privacy laws. Profiles can define elements that automatically trigger compliance checks, such as patient data encryption.
Automotive Engineering 🚗
Modern cars are complex networks. Profiles help model the interaction between sensors, control units, and safety mechanisms.
Financial Services 💰
Banking systems need audit trails. Profiles can define transaction elements with mandatory logging requirements.
Frequently Asked Questions ❓
Here are answers to common questions regarding profile diagrams.
Do I need a specific tool to create a profile diagram? 🛠️
No. While many modeling tools support profiles, the concept is independent of the software. You can draft the logic on paper or in a text editor before implementing it in a tool.
Can I change a profile after it is published? 🔄
Yes, but you must manage the migration. Changing a stereotype might require updating existing diagrams that use it. Communication is key.
What is the difference between a Profile and a Template? 📄
A profile defines the vocabulary (the words you can use). A template defines the structure (the layout you start with). You can use a profile within a template.
How do I ensure my profile is compatible with other teams? 🤝
Use standard base elements. If your stereotypes extend standard UML elements, other teams who use UML will understand the extensions more easily.
Is a profile diagram the same as a package diagram? 📦
No. A package diagram organizes elements into groups. A profile diagram defines the rules and extensions for those elements.
Can I use profiles for non-software systems? ⚙️
Absolutely. While common in software, profiles are useful for business process modeling, hardware architecture, and organizational structures.
How do I handle conflicts between profiles? ⚔️
Assign priorities. If two profiles define the same stereotype, the more specific one usually takes precedence. Document these rules clearly.
What happens if a constraint is violated? 🚨
In a tool, the modeler might receive a warning or an error. In a manual review, the violation should be flagged during the validation step.
Can I export a profile for use elsewhere? 📤
Yes, most modeling environments allow you to export profile definitions as a package or file that can be imported into other projects.
Is learning profile diagrams difficult? 📚
It requires understanding the base language first. If you understand the core modeling concepts, the extension logic is straightforward.
Final Thoughts on Profile Diagrams 🌟
Mastering the creation of profile diagrams enhances your ability to communicate complex system designs. By extending standard modeling languages, you create a shared vocabulary that bridges the gap between technical teams and business stakeholders. Remember to keep your definitions clear, your constraints logical, and your documentation thorough. With practice, these diagrams become powerful tools for ensuring system integrity and consistency.
Start small. Define one or two stereotypes for your current project. Observe how they improve clarity. Gradually expand the profile as your needs grow. This iterative approach ensures that your modeling efforts remain manageable and effective.