
Understanding system architecture requires a language that can express specific domain concepts while adhering to standard modeling principles. This is where the Profile Diagram becomes essential. It allows modelers to extend the Unified Modeling Language (UML) without changing the core language itself. For beginners, these diagrams can appear dense and abstract. However, with a structured approach, the logic becomes clear. This guide breaks down the components, syntax, and semantics of profile diagrams to help you navigate them with confidence.
When you encounter a complex diagram involving stereotypes, tagged values, and constraints, do not panic. Every element serves a specific purpose. By understanding the underlying structure, you can interpret the design intent accurately. This article focuses on the visual syntax and the semantic meaning of each component.
What is a Profile Diagram? 🔍
A Profile Diagram is a specialized type of UML diagram used to define new semantics for existing modeling elements. It does not describe a running system like a Sequence Diagram. Instead, it defines the rules for a specific domain. Think of it as a dictionary extension for your modeling language.
Standard UML elements like Class, Interface, or Component have fixed definitions. However, in a banking system, a Class might need to be treated as a Transaction or a Customer. A Profile allows you to create these custom labels. It attaches metadata to standard elements to add domain-specific meaning.
Key characteristics of a Profile Diagram include:
- Metamodel Extension: It adds new properties to existing UML metaclasses.
- Domain Specificity: It tailors the model to a specific industry or technology stack.
- Reusability: Once defined, the profile can be applied to multiple models within an organization.
- Visualization: It shows how stereotypes and constraints are organized.
Core Components of a Profile 🧱
To read a profile diagram effectively, you must recognize the four main building blocks. These elements work together to define how the model behaves and what data it holds.
1. Stereotypes 🔖
Stereotypes are the visual markers that indicate a specialized type of element. In a diagram, they appear as text enclosed in guillemets, such as « stereotype ». For example, a standard Class box might be labeled « Entity » or « Boundary ».
When reading a diagram, the stereotype tells you the role the element plays. It overrides the default behavior or adds specific constraints. If you see a Class with the stereotype « Service », you know it is intended to provide functionality rather than store data.
2. Tagged Values 🏷️
Tagged values provide a way to attach specific data to a model element. Unlike attributes in a class, tagged values are metadata about the model itself. They are often displayed in a list within the element box or in a dedicated compartment.
Common uses for tagged values include:
- Specifying database table names.
- Defining version numbers for a component.
- Recording ownership or author details.
- Setting configuration parameters.
When reviewing a diagram, check the tagged values for critical implementation details. They often contain information that is not obvious from the visual structure alone.
3. Constraints 🚧
p>Constraints are rules that limit the behavior or structure of elements. They are usually written inside curly braces, like { OCL expression }. Constraints ensure data integrity and logical consistency.For instance, a constraint might state that a specific attribute must be unique across all instances. When reading a profile, pay close attention to these rules. They define the boundaries within which the system must operate.
4. Extensions 🧩
Extensions link the new profile elements to the base UML metamodel. This is the mechanism that makes the profile functional. An extension connects a stereotype to a specific metaclass, such as Class or Association.
Without an extension, a stereotype is just a label. The extension activates the profile logic. In a diagram, this is often represented by a relationship line connecting the stereotype definition to the target metaclass.
Visual Syntax and Notation 🎨
Consistency in notation is vital for readability. While tools may vary, the standard conventions remain the same. Understanding these visual cues helps you parse the diagram quickly.
Package Structure 📦
Profiles are typically organized within packages. A top-level package represents the profile itself. Inside, you will find sub-packages for different categories of stereotypes.
- Profile Package: The root container for the profile definition.
- Metaclass Package: Groups stereotypes by the UML element they extend.
- Constraint Package: Holds the logical rules applied to the model.
Font and Formatting
Visual hierarchy aids comprehension. Follow these standard formatting rules:
- Stereotype Name: Usually italicized and enclosed in « ».
- Tagged Value: Often listed as key : value pairs.
- Constraint: Enclosed in { } brackets, often in a smaller font.
- Relationships: Dashed lines typically indicate dependencies or extensions.
Relationships in Profile Diagrams 🔗
Profile diagrams are not just lists of definitions; they show how elements relate to one another. Understanding these connections is crucial for interpreting the architecture.
Association Relationships
Associations link different elements together. In a profile, an association might link a stereotype to a metaclass. This relationship defines which elements can accept the stereotype.
Dependency Relationships
Dependencies indicate that one element relies on another. A stereotype might depend on a specific constraint to be valid. If the constraint changes, the stereotype definition may need updating.
Realization Relationships
Realization shows that one element implements the interface or contract of another. In profiling, this often appears when a stereotype realizes a general interface provided by the UML standard.
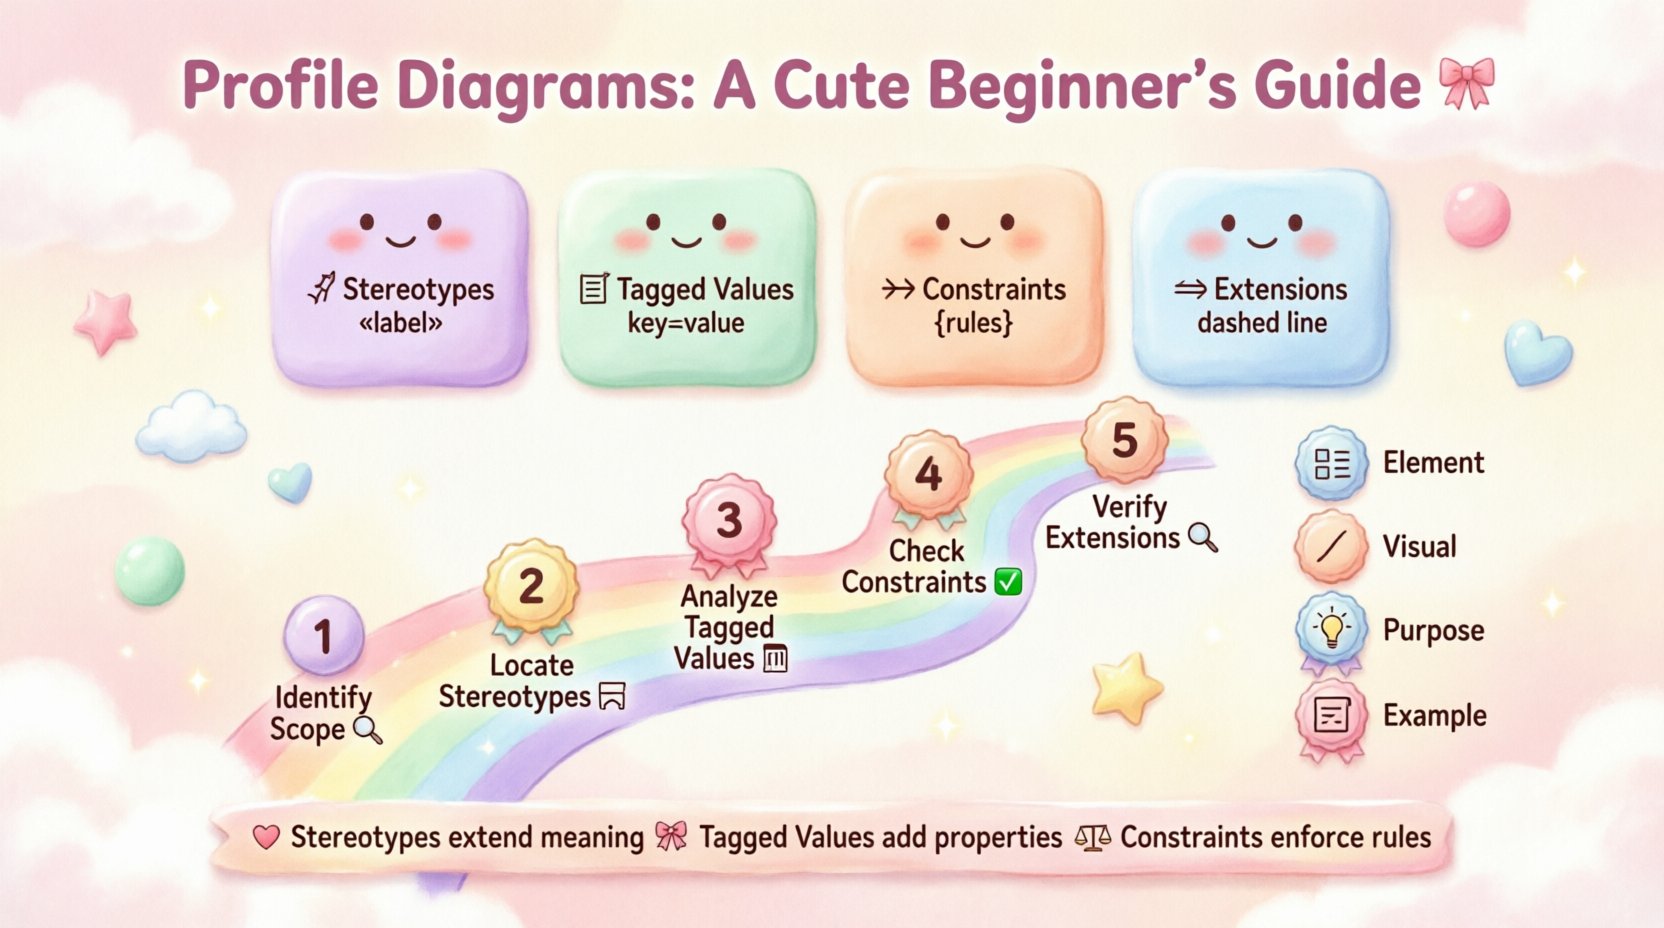
Step-by-Step Reading Strategy 📝
Approaching a complex profile diagram can be overwhelming. Use this systematic method to break down the information.
Step 1: Identify the Scope
Look at the package structure. Determine which domain the profile covers. Is it for web services, database schemas, or business logic? This context frames your understanding of the stereotypes.
Step 2: Locate the Stereotypes
Find the main stereotypes in the diagram. These are the primary actors. Note which metaclass they extend. This tells you where they can be applied in your model.
Step 3: Analyze Tagged Values
Examine the tagged values for each stereotype. What data does this element carry? Are there required values or optional ones? This step reveals the data requirements.
Step 4: Check Constraints
Read the constraints attached to the stereotypes. What rules must be followed? Are there mathematical conditions or logical exclusions? This ensures you understand the limitations.
Step 5: Verify Extensions
Confirm the extension relationships. Do the stereotypes correctly link to the intended metaclasses? This validates the technical correctness of the profile.
Comparison of Profile Elements 📊
To help you distinguish between similar concepts, here is a comparison of the key components.
| Element | Visual Indicator | Purpose | Example |
|---|---|---|---|
| Stereotype | « Name » | Defines a new type of element | « API Endpoint » |
| Tagged Value | key : value | Attaches metadata to an element | table : users |
| Constraint | { Rule } | Enforces logical rules | { unique(id) } |
| Extension | Dashed Line | Links stereotype to metaclass | Link to Class |
Common Pitfalls in Profile Design ⚠️
Even experienced modelers make mistakes when creating or reading profiles. Being aware of common errors helps you avoid confusion.
1. Ambiguous Naming
Using generic names like « Type » or « Object » makes it hard to distinguish the stereotype from standard UML elements. Use descriptive names that reflect the specific domain meaning.
2. Overloading Tagged Values
Adding too many tagged values to a single stereotype clutters the diagram. Keep metadata relevant to the stereotype’s purpose. If a value is rarely used, consider moving it to a different profile.
3. Ignoring Constraints
Defining a stereotype without constraints can lead to misuse. A profile should guide the modeler. Ensure rules are clearly defined so that invalid models are caught early.
4. Inconsistent Extensions
Applying a stereotype to the wrong metaclass causes logical errors. Always verify that the extension relationship matches the intended target element.
Hypothetical Scenario: Web Service Profile 🌐
Let us walk through a practical example. Imagine a team is modeling a microservices architecture. They create a profile for web services.
The Profile Structure
- Package: WebServiceProfile
- Stereotype: « Service » extending Class
- Tagged Values: method (GET, POST), endpoint (string)
- Constraint: { endpoint must start with /api }
Reading the Diagram
When you see a Class box with the « Service » stereotype, you know it represents a web endpoint. The tagged values tell you the HTTP method and the path. The constraint ensures all endpoints follow the organization’s routing standards.
If you see a dependency between two « Service » stereotypes, it indicates an API call between services. This visual cue replaces the need for complex sequence diagrams in the high-level architecture view.
Best Practices for Maintenance 🛠️
Profiles evolve over time. As requirements change, the profile must adapt. Follow these guidelines to keep your diagrams useful.
- Version Control: Track changes to the profile. Document what was added or removed in each version.
- Documentation: Include a text description alongside the diagram. Visuals alone may not explain the intent.
- Consistency: Ensure all modelers use the same profile definitions. Inconsistent application leads to confusion.
- Review: Periodically audit the profile. Remove unused stereotypes and update obsolete constraints.
Advanced Techniques for Complex Profiles 🔬
For large-scale systems, profiles can become intricate. Advanced techniques help manage this complexity.
Nesting Profiles
You can define profiles within profiles. This allows for layered abstraction. A general architecture profile can contain specific domain profiles.
Profile Inheritance
One profile can extend another. This reduces redundancy. If a base profile defines common constraints, a derived profile can inherit them and add specific rules.
Tool Integration
Ensure the profile is compatible with the modeling tools used. Some tools support profile validation automatically. Others require manual checks. Know the capabilities of your environment.
Interpreting Visual Hierarchy 👁️
Visual hierarchy guides the eye. Larger boxes usually represent higher-level concepts. Smaller compartments hold details. Use this to prioritize information.
- Top Level: Focus on package names and main stereotypes.
- Mid Level: Examine relationships between stereotypes.
- Bottom Level: Review tagged values and constraints.
Troubleshooting Reading Issues 🛑
Occasionally, a diagram will be unclear. Here is how to resolve common issues.
Issue: Missing Stereotypes
If a stereotype is not visible, check the package visibility settings. Ensure the profile is imported into the model context.
Issue: Unclear Constraints
If a constraint is hard to read, look for a legend or documentation file. Constraints are often defined in a separate text file for clarity.
Issue: Conflicting Relationships
If relationships seem contradictory, verify the direction of the arrows. Dependencies are directional. Ensure the flow of information matches the logical flow.
Summary of Key Takeaways 📌
- Profile diagrams extend UML to fit specific domains.
- Stereotypes define new element types visually.
- Tagged values attach metadata to elements.
- Constraints enforce logical rules and integrity.
- Extensions link stereotypes to metaclasses.
- Consistent notation improves readability.
- Regular maintenance ensures long-term utility.
Final Thoughts on Visual Modeling 💭
Mastering profile diagrams is a skill built over time. Start with simple profiles and gradually increase complexity. Focus on the semantics behind the symbols. When you understand what the diagram represents, the visual syntax becomes secondary. This approach ensures that your models remain clear, maintainable, and valuable assets for the entire development team.
By applying the strategies outlined in this guide, you can decode even the most intricate profile diagrams. The goal is not just to read the diagram, but to understand the system it describes. This deeper understanding leads to better design decisions and more robust software architecture.