
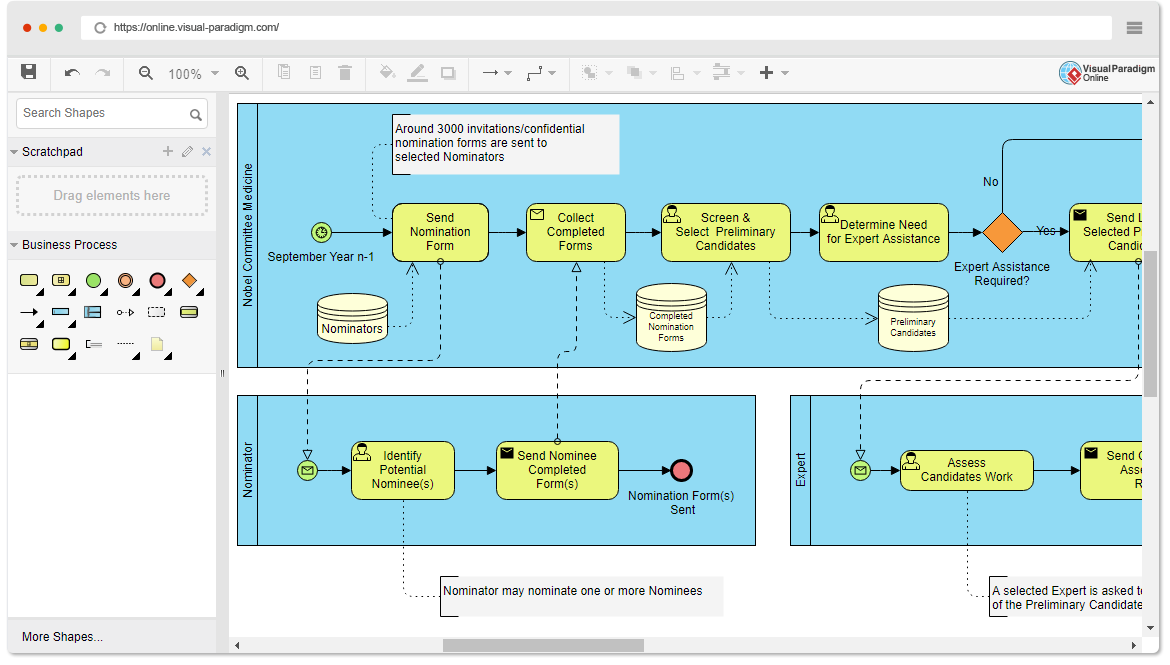
Business Process Model and Notation (BPMN) is the industry standard for representing business processes in a graphical format that is easy for business stakeholders to understand yet precise enough for technical implementation. This tutorial utilizes a real-world example—the Nobel Prize Nomination Process—to demonstrate how to architect complex workflows using Visual Paradigm. By analyzing this diagram, we will explore the critical concepts of swimlanes, data stores, event triggers, and decision gateways.
Structuring Complexity with Swimlanes
When modeling a process involving multiple distinct roles, chaos can easily ensue. Visual Paradigm solves this through the use of Swimlanes. In the provided diagram, the process is divided into three distinct vertical sections, each representing a specific actor or organizational unit:
- Nobel Committee Medicine: The central authority responsible for initiating the process, screening candidates, and managing the final selection.
- Nominator: External or internal individuals empowered to identify and submit potential candidates.
- Expert: Specialists tasked with evaluating the technical work of the candidates.
Visual Paradigm allows you to drag these lanes onto the canvas to ensure that every action is attributed to the correct role. This separation clarifies the handoffs between roles, which are often the source of bottlenecks in real-world business operations.
Sequencing with Flow Objects
The core of any BPMN diagram is the flow of control, defined by Flow Objects. In this workflow, we see a clear progression:
1. Events (Triggers)
The process begins with a Start Event, indicated by a circle with a clock icon. This signifies that the process is time-dependent and initiates at a specific point (labeled “September Year n-1”). Without this explicit trigger, the process remains dormant.
2. Activities (Tasks)
Yellow rounded rectangles represent Tasks. These are the actual work performed, such as “Send Nomination Form” or “Collect Completed Forms.” Visual Paradigm allows you to group these tasks logically and assign them to the appropriate swimlane.
3. Gateways (Decision Logic)
Business processes rarely follow a straight line. The Gateway (the orange diamond shape) represents a decision point. In the “Nobel Committee Medicine” lane, the process reaches a decision: “Determine Need for Expert Assistance?”
- Yes Path: If expertise is required, the flow branches to the “Expert” lane to “Assess Candidates Work.”
- No Path: If no assistance is needed, the process bypasses the expert and proceeds directly to selecting the preliminary candidates.
Managing Data with Data Stores
A critical feature of this model is the integration of data management. Unlike simple flowcharts that only show movement, BPMN shows information flow. Visual Paradigm supports Data Stores (the open-ended cylinder shapes), which represent persistent storage.
Notice the following data interactions in the diagram:
- Nominators Data Store: The “Send Nomination Form” task interacts with this store, implying that the committee accesses a database of potential nominators.
- Completed Nomination Forms Data Store: As forms are collected, they are archived here.
- Preliminary Candidates Data Store: Once the screening is complete, the names of the top candidates are stored here for the final selection phase.
Using dashed lines to connect these stores to tasks ensures that the data lifecycle is fully documented, a requirement for robust system architecture.
Step-by-Step Modeling in Visual Paradigm
To replicate a workflow like this in Visual Paradigm, follow these technical steps:
- Initialize the Diagram: Select Business Process Diagram from the menu to load the BPMN palette.
- Define Swimlanes: Drag a Pool onto the canvas and name it. Then, add Lanes for “Nobel Committee,” “Nominator,” and “Expert.”
- Place Flow Objects: Drag Start Events (clock icons) to the left of each lane to define where their specific responsibilities begin.
- Connect Tasks: Use the Sequence Flow tool (solid arrow) to connect tasks within the same lane to establish the internal logic.
- Add Data Stores: Drag the Data Store symbol from the palette. Use Data Input/Output Associations (dashed lines with arrowheads) to link specific tasks to the data they create or read.
- Implement Gateways: Drag a Exclusive Gateway (diamond) to handle the “Expert Assistance” decision, connecting the “Yes” and “No” paths appropriately.
Conclusion
Visual Paradigm transforms complex business logic into a clear, actionable map. By utilizing swimlanes for role separation, gateways for decision logic, and data stores for information management, organizations can ensure that critical processes like the Nobel Prize nomination are efficient, transparent, and error-free.