
Software architecture is rarely a flat landscape. Systems grow, layers stack, and internal mechanisms become intricate labyrinths that define how data flows and how components interact. When standard diagrams fall short of capturing the internal topology of a single class or component, a more granular tool is required. This is where the Composite Structure Diagram comes into play. It offers a specialized lens for examining the internal arrangement of parts, their collaborations, and the interfaces they expose to the rest of the system. This guide explores the mechanics, utility, and strategic application of this UML 2.x artifact.
What is a Composite Structure Diagram? 🧩
A Composite Structure Diagram depicts the internal structure of a classifier, such as a class or component, and shows how parts within that classifier interact. Unlike a standard Class Diagram, which focuses on attributes and methods at the top level, this diagram dives deeper. It answers the question: “What is inside this box, and how does it work?”
This visualization technique is crucial when:
- Dealing with complex subsystems that need internal decomposition.
- Designing patterns where delegation and port mapping are central.
- Clarifying how external interfaces are realized by internal parts.
- Managing large-scale systems where internal state and behavior must be isolated.
By breaking down a classifier into its constituent parts, architects can manage cognitive load. Instead of viewing a monolithic entity, teams see a collection of interacting units. This granularity supports better maintenance, testing, and refactoring strategies.
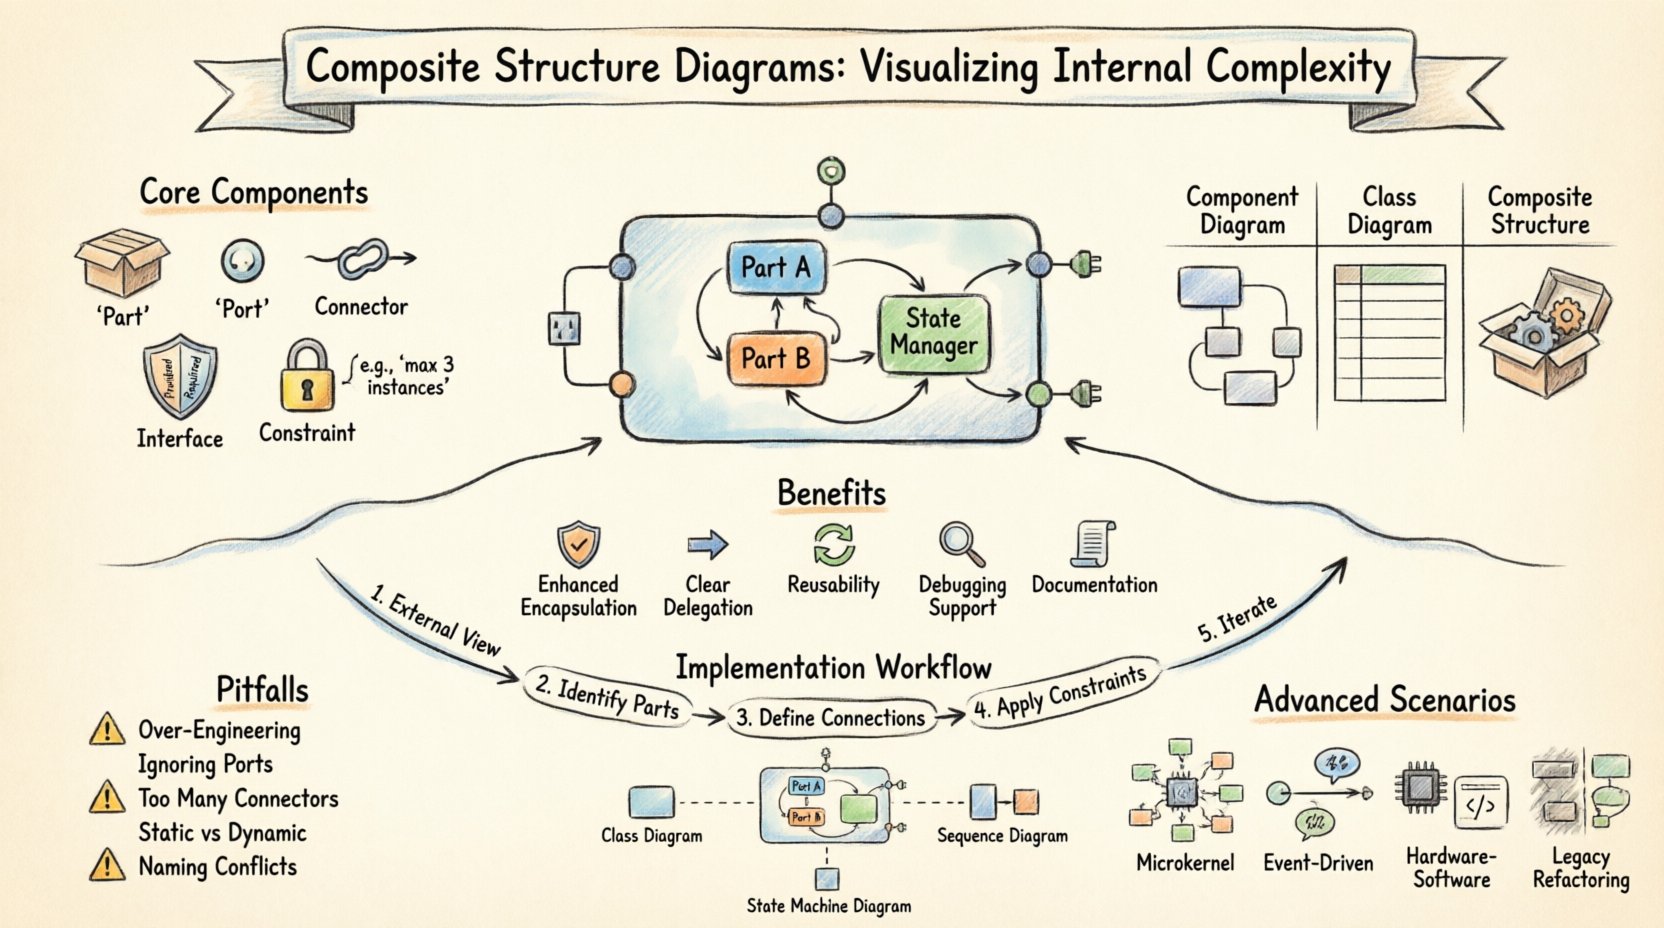
Core Components of the Diagram 🔍
To utilize this diagram effectively, one must understand its specific vocabulary. Each element serves a distinct purpose in defining the internal topology.
1. The Part 📦
A Part represents an instance of a classifier within the context of the composite structure. It is a specific role played by a class inside the larger structure. Parts are essential for showing composition and aggregation relationships internally. They define the data and behavior available to other parts within the same boundary.
2. The Port 🌐
Ports are interaction points. They act as the boundary between the internal structure and the external environment. A port specifies a set of operations that a part can provide or require. They are critical for encapsulation, ensuring that internal logic is not directly exposed but rather accessed through defined interfaces.
3. The Connector 🔗
Connectors link parts to each other or parts to ports. They define the flow of information or control. There are two primary types:
- Internal Connector: Links two parts within the same structure.
- External Connector: Links a part or port to an element outside the structure.
Connectors ensure that the internal logic remains cohesive while allowing necessary communication.
4. The Interface 🛡️
Interfaces define the contract. In a composite structure, interfaces are often realized by ports. A port can have a required interface (it needs something) or a provided interface (it offers something). This distinction is vital for understanding dependencies.
5. The Constraint 🔒
Constraints define the rules governing the internal structure. They might limit the number of parts, specify the type of connection, or enforce state conditions. These are often expressed in text or formal languages within the diagram.
Why Use This Diagram Over Others? ⚖️
Architects often face a choice between a Component Diagram, a Class Diagram, or a Composite Structure Diagram. Each serves a different purpose. Understanding the distinctions prevents modeling errors.
| Diagram Type | Primary Focus | Best Used For |
|---|---|---|
| Component Diagram | High-level modules and their dependencies | System integration and deployment views |
| Class Diagram | Attributes, methods, and relationships | Static structure and data modeling |
| Composite Structure Diagram | Internal arrangement of parts and ports | Internal design of complex classes/subsystems |
While a Component Diagram looks at the system as a collection of black boxes, a Composite Structure Diagram opens the lid to see the gears. It is particularly useful when the internal implementation details are as important as the interface itself. For example, when designing a microkernel architecture, the internal delegation of tasks is the core logic, making this diagram indispensable.
Key Benefits of Internal Visualization 🚀
Adopting this modeling approach yields several tangible advantages for development teams.
- Enhanced Encapsulation: By explicitly defining ports, teams are forced to think about what is exposed and what is hidden. This reduces coupling.
- Clear Delegation Paths: Connectors show exactly where responsibility shifts from one part to another. This clarifies the flow of control.
- Reusability: Internal parts can often be modeled as standard classes elsewhere, promoting reuse across different composite structures.
- Debugging Support: When a failure occurs, the diagram helps trace the path of data between internal parts to locate the source.
- Documentation: It serves as a living document that explains the “why” behind the code structure, not just the “what”.
Implementation Strategies 🛠️
Creating these diagrams requires a disciplined approach. Rushing into drawing without a plan often leads to cluttered and confusing models.
1. Start with the External View
Before detailing the inside, define the external interface. What does this class or component offer to the outside world? This determines the provided interfaces on the ports.
2. Identify Internal Parts
List the logical components that make up the functionality. Are they helper objects? State managers? Data repositories? Group these logically.
3. Define Connections
Map out how data moves. Use internal connectors to link parts. Ensure that the flow makes logical sense and does not create circular dependencies that cannot be resolved.
4. Apply Constraints
Add necessary rules. For example, a specific part might only be active when a certain state is reached. Document this clearly.
5. Iterate and Refine
Complexity often reveals itself during review. Be prepared to split a large composite structure into smaller ones if the diagram becomes too dense to read.
Common Pitfalls and How to Avoid Them ⚠️
Even experienced modelers can fall into traps when working with internal structures. Awareness of these common issues can save significant time.
- Over-Engineering: Do not diagram every single class. Only use this diagram when the internal structure is complex enough to warrant it. Simple classes should remain as standard Class Diagrams.
- Ignoring Ports: Skipping ports and connecting parts directly to the boundary can violate encapsulation principles. Always route external communication through ports.
- Too Many Connectors: A web of connectors without clear logic is hard to follow. Use grouping or sub-structures to organize complex connections.
- Static vs. Dynamic: Remember that this diagram represents static structure. It does not show the sequence of messages over time. Use Sequence Diagrams for temporal behavior.
- Naming Conflicts: Ensure that part names and port names are distinct to avoid ambiguity during implementation.
Advanced Scenarios 🧠
There are specific architectural patterns where this diagram shines. Understanding these contexts helps in deciding when to apply the technique.
1. Microkernel Architectures
In a microkernel system, the core is minimal, and plugins provide functionality. A Composite Structure Diagram can show the core kernel, its ports for plugin registration, and the internal parts that manage the plugin lifecycle.
2. Event-Driven Systems
When parts communicate via events rather than direct calls, the diagram helps visualize the event sources and sinks. Connectors can represent the event channels between internal components.
3. Hardware-Software Integration
For embedded systems, parts might represent physical hardware modules while other parts represent the software drivers controlling them. The diagram bridges the gap between physical constraints and logical design.
4. Legacy System Refactoring
When modernizing legacy code, understanding the existing internal structure is key. This diagram can map the old spaghetti code into a cleaner structure before refactoring begins.
Relationship with Other Diagrams 🔄
Composite Structure Diagrams do not exist in isolation. They complement other UML diagrams to provide a complete picture of the system.
- Class Diagram: The Class Diagram defines the blueprint. The Composite Structure Diagram shows the instance of that blueprint in action internally.
- Sequence Diagram: Sequence Diagrams show the interaction over time. The Composite Structure Diagram provides the static context for those interactions.
- State Machine Diagram: State diagrams show the behavior of a single object. Composite structures show the arrangement of objects working together.
Integrating these views ensures that the design is consistent. If a Sequence Diagram shows a message sent to a part that does not exist in the Composite Structure Diagram, there is a modeling error that needs correction.
Best Practices for Maintenance 📝
A diagram is only useful if it remains accurate. Keeping these models up to date requires discipline.
- Version Control: Treat diagram files like code. Commit changes to a repository to track evolution.
- Code Generation: If possible, use tools that can generate code from the diagram or vice versa. This reduces the gap between design and implementation.
- Regular Reviews: Include diagram reviews in sprint planning or architecture review boards. Ensure the model reflects the current codebase.
- Simplicity First: If a diagram has more lines than code, it is likely too complex. Break it down into sub-structures.
- Documentation Links: Link diagrams to relevant requirements or user stories. This provides context for why a specific internal structure was chosen.
Conclusion on Strategic Modeling 💡
Visualizing complexity is not about making things look pretty. It is about reducing ambiguity and ensuring that every part of the system has a defined role and relationship. The Composite Structure Diagram provides the necessary granularity to manage deep internal architectures without losing sight of the external contract.
By focusing on parts, ports, and connectors, teams can build systems that are modular, maintainable, and robust. It shifts the focus from “what does the class do” to “how does the class work internally”. This shift in perspective is often the difference between a system that survives change and one that crumbles under it.
Adopting this approach requires practice. It demands that architects think in terms of composition and delegation rather than just inheritance and attributes. However, the payoff is a clearer mental model of the software, which translates directly into better code and fewer defects. As systems grow in size and difficulty, the ability to visualize their internal structure becomes a critical skill for any technical leader.
Start small. Diagram one complex class. Observe how the internal parts interact. Refine the ports. Once comfortable, expand to subsystems. Over time, this method becomes a natural part of the design process, ensuring that complexity is managed rather than allowed to proliferate unchecked.