
Modern software systems are rarely monolithic. They are complex ecosystems of services, databases, interfaces, and external dependencies. As these systems grow in scale and distributed nature, the clarity of their structural definitions becomes critical. One of the most effective ways to define these structural definitions is through the use of Profile Diagrams. These diagrams serve as the blueprint for understanding where a system begins and ends, establishing the rules of engagement for all interacting components.
This guide explores the mechanics and strategic value of Profile Diagrams in system architecture. We will examine how they clarify scope, manage complexity, and facilitate communication among technical stakeholders. By visualizing system boundaries effectively, organizations can reduce integration errors, streamline development cycles, and ensure long-term maintainability.
🧩 What is a Profile Diagram?
In the context of software architecture, a Profile Diagram acts as a specialized extension mechanism. It allows architects to define a specific vocabulary tailored to a particular domain or technology stack. Unlike standard diagrams that focus on flow or deployment, profile diagrams focus on the semantic meaning of elements within the system.
These diagrams are grounded in the Unified Modeling Language (UML) specification. They utilize a concept known as stereotypes to categorize elements. This categorization helps teams distinguish between internal components, external services, and boundary interfaces. The primary goal is not to draw every line of code, but to define the contract of interaction.
Key characteristics include:
- Domain Specificity: They are tailored to the business domain, such as finance, healthcare, or logistics.
- Extension Capability: They allow the addition of new properties and constraints to existing model elements.
- Boundary Definition: They explicitly mark the transition points between different system contexts.
- Consistency: They enforce naming conventions and structural rules across the architecture.
When an architect creates a profile, they are essentially creating a language that the development team speaks. This language defines what a “User Service” is, what a “Payment Gateway” is, and how they relate to one another. This consistency is vital when multiple teams work on different parts of the same ecosystem.
🚧 The Critical Nature of System Boundaries
Defining boundaries is often more important than defining the internals. A system boundary dictates where responsibility lies. If a boundary is unclear, teams may assume someone else is handling a specific function, leading to gaps in coverage. Conversely, if the boundary is too rigid, it can stifle necessary innovation and integration.
Why Visualizing Boundaries Matters
Visualizing these limits provides several tangible benefits:
- Scope Management: It prevents scope creep by clearly showing what is inside the system and what is outside. This is essential for project estimation and resource allocation.
- Interface Definition: It forces teams to define the contract. If a service crosses a boundary, it must do so through a defined interface, reducing coupling.
- Security Zones: Boundaries often correlate with trust zones. Visualizing them helps in applying the correct security protocols for internal versus external traffic.
- Data Ownership: It clarifies which system owns specific data sets. This reduces conflicts in data governance and compliance requirements.
- Team Alignment: It supports Conway’s Law. By defining boundaries, you can align organizational teams with the system structure, reducing communication overhead.
Without these visualizations, architects often rely on mental models that differ between individuals. A diagram provides a single source of truth regarding where one responsibility ends and another begins.
🛠️ Anatomy of a Profile Diagram
To understand how these diagrams function, we must look at their constituent parts. A well-constructed profile diagram is not just a collection of boxes; it is a structured representation of constraints and relationships.
Core Elements
- Profiles: The root container that holds the specific definitions. It acts as a namespace for the stereotypes defined within.
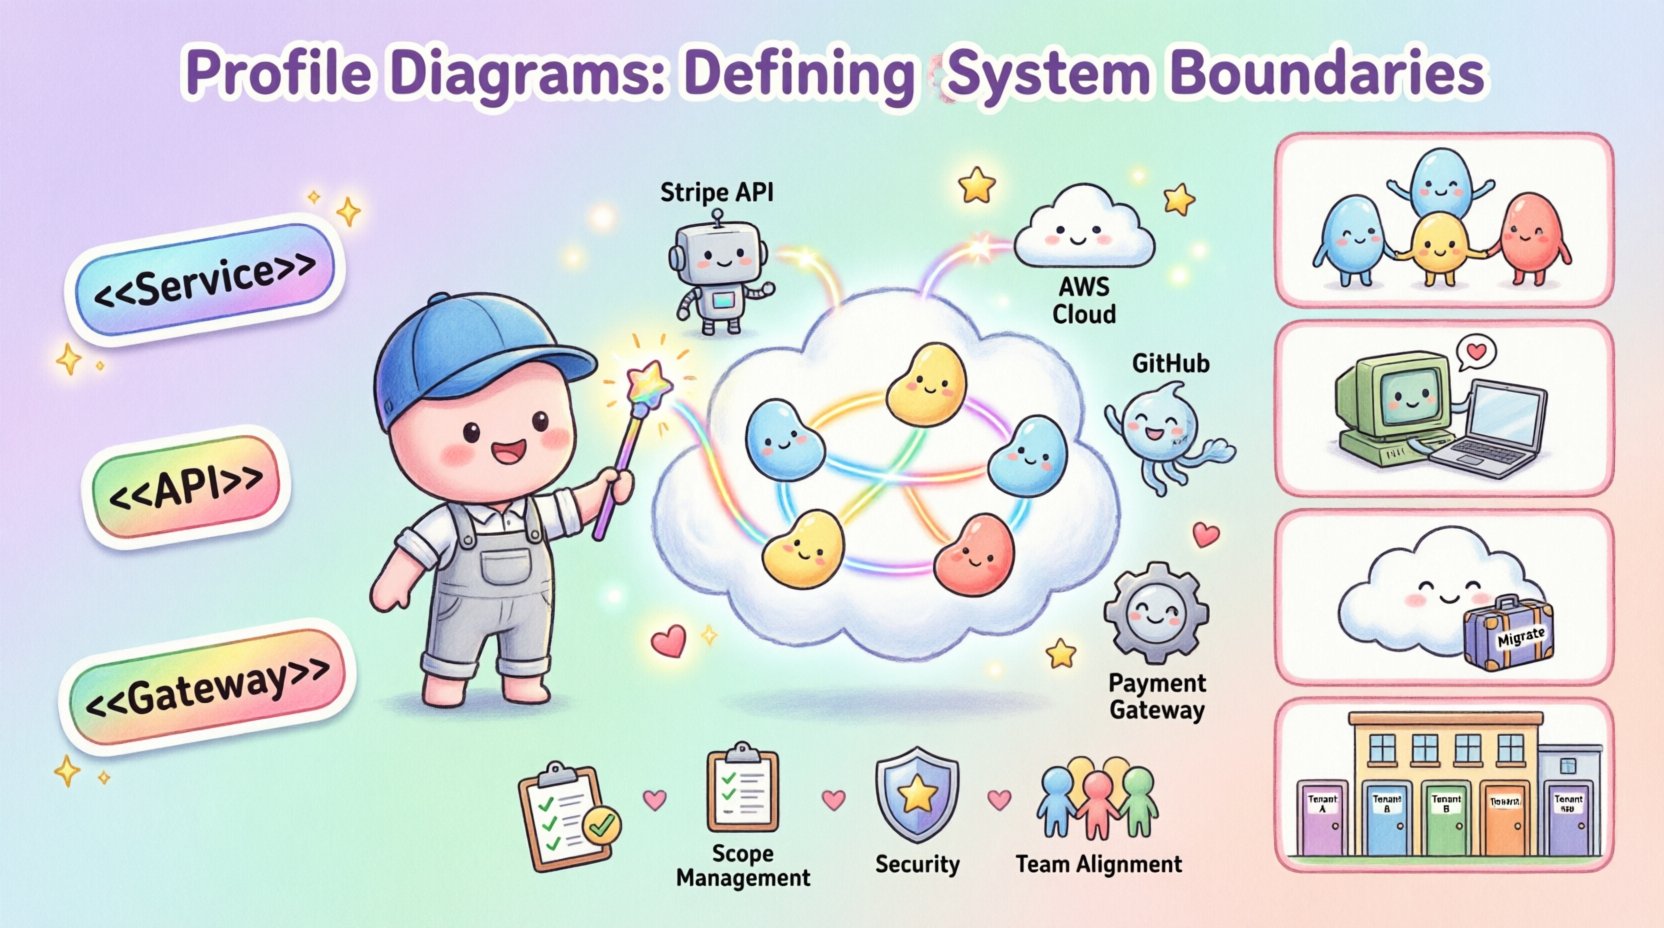
- Stereotypes: These are the tags applied to model elements. For example, a class might be tagged as <
> or < >. These tags carry specific semantic meaning defined by the profile. - Tags: Key-value pairs that provide additional metadata. Examples include
version,owner, orsecurityLevel. - Constraints: Logical rules that elements must adhere to. A constraint might state that a specific service cannot be accessed directly without an authentication layer.
- Relationships: Arrows and lines showing dependencies. In a profile context, these often represent data flow or API calls across boundaries.
Visual Hierarchy
The diagram typically uses a hierarchical approach. At the top level, you see the System Context. Below that, you see Subsystems or Domains. Finally, at the lowest level, you see specific Components or Interfaces. This nesting helps in understanding the scope of the boundary at different levels of abstraction.
🌐 Strategic Use Cases
Profile diagrams are versatile tools. They can be applied to various architectural challenges across different technology landscapes. Below are specific scenarios where they provide the most value.
1. Microservices Architecture
In microservices, the boundary between services is the most critical aspect. A profile diagram can define the API Contract for each service. It clarifies which services are allowed to talk to which other services directly, and which must go through an API Gateway.
By tagging services with stereotypes like <
2. Legacy System Integration
When integrating modern systems with legacy mainframes or older databases, the boundary is often a source of friction. A profile diagram can model the Adapter Pattern. It visually represents the wrapper that shields the new system from the quirks of the old system.
This helps stakeholders understand that the legacy system is treated as a black box with a specific boundary. It prevents the temptation to refactor the legacy code without understanding the impact on the boundary.
3. Cloud Migration
Moving to the cloud involves shifting boundaries. Some services move to the cloud, while others remain on-premise. A profile diagram can map the Hybrid Boundary. It defines which data stays on-premise and which moves to the cloud, ensuring compliance with data residency laws.
It also helps in visualizing the network boundary. It distinguishes between public subnets and private subnets, ensuring that the architectural design aligns with cloud security best practices.
4. Multi-Tenant Systems
For software-as-a-service platforms, the boundary between tenants is paramount. A profile diagram can define the Logical Tenant Boundary. It shows how data isolation is achieved at the database or application layer.
This is crucial for security audits. It proves to auditors that the system architecture enforces isolation, preventing one tenant from accessing another’s data.
📊 Comparison of Diagram Types
It is important to distinguish Profile Diagrams from other standard architectural diagrams. While they serve overlapping purposes, their focus differs. The table below outlines the distinctions.
| Diagram Type | Primary Focus | Boundary Definition | Best Used For |
|---|---|---|---|
| Profile Diagram | Semantic definitions and stereotypes | High (Logical and Contractual) | Defining domain vocabularies and contracts |
| Context Diagram | External actors and system scope | Medium (System vs Environment) | High-level stakeholder communication |
| Component Diagram | Internal structure and dependencies | Low (Internal modules) | Developers working on code structure |
| Deployment Diagram | Physical infrastructure and nodes | Low (Hardware boundaries) | DevOps and infrastructure planning |
As seen in the table, the Profile Diagram excels at defining the rules of interaction rather than just the physical location or internal code structure. It bridges the gap between business logic and technical implementation.
🛡️ Best Practices for Boundary Definition
Creating a profile diagram is an exercise in discipline. To ensure the diagram remains useful over time, follow these guidelines.
- Consistent Naming Conventions: Use a standard naming convention for all stereotypes. For example, prefix all interfaces with
IF-or use<<Service>>consistently. - Minimize Dependencies: When drawing relationships, minimize cross-boundary dependencies. If two subsystems depend heavily on each other, consider merging their boundaries.
- Document Constraints: Do not just draw lines. Annotate them with constraints. For example, write
[timeout: 5s]on a connection line to specify performance requirements. - Version Control: Treat the diagram as code. Store it in a version control system. Changes to boundaries should be reviewed and tracked.
- Keep it Abstract: Avoid detailing specific IP addresses or class names unless necessary. Keep the focus on the logical boundary.
- Review with Stakeholders: Regularly review the boundaries with product owners. A boundary that makes technical sense might not make business sense.
⚠️ Common Pitfalls to Avoid
Even experienced architects can make mistakes when defining boundaries. Being aware of these common pitfalls can save significant time and effort.
1. The Over-Engineered Profile
Creating a profile with too many stereotypes and tags can make the diagram unreadable. If the profile requires a complex legend to understand, it has failed. Keep the vocabulary simple and intuitive.
2. Ignoring External Systems
A common mistake is to treat external systems as invisible. In reality, external APIs and third-party services are critical parts of the boundary. They should be explicitly modeled with their own constraints and error handling requirements.
3. Static Boundaries
Boundaries change. A system that starts as monolithic often evolves into microservices. If the profile diagram is static, it becomes outdated quickly. Plan for evolution by defining boundaries in a way that allows for splitting later.
4. Confusing Data with Logic
Do not mix data flow diagrams with profile diagrams. A profile diagram defines the logical structure. Data flow belongs in a different view. Mixing them creates clutter and confusion regarding where the system logic actually resides.
🔄 Maintenance and Evolution
A profile diagram is a living artifact. It requires maintenance just like the software it describes. As the system evolves, the boundaries may shift. New APIs may be exposed, or legacy interfaces may be retired.
Review Cycles
Establish a review cycle for the architecture. During these reviews, check if the profile diagrams still match the code. If a new service has been added without a corresponding profile update, the documentation is no longer accurate.
Automated Validation
Where possible, use tools to validate the architecture against the profile. If the profile defines a security constraint, the build pipeline should verify that the code adheres to it. This ensures the diagram remains a reflection of reality.
Onboarding New Teams
Use the profile diagram as an onboarding tool. New developers can look at the diagram to understand the system’s structure and boundaries before writing code. This reduces the learning curve and prevents architectural violations.
🔗 Integration with Other Architectural Views
A profile diagram does not exist in isolation. It works in tandem with other views of the system architecture. It provides the semantic layer that other diagrams build upon.
- With Context Diagrams: The profile diagram defines the internal logic of the system boundary shown in the context diagram.
- With Component Diagrams: The profile defines the stereotypes for the components. It tells you what type of component it is.
- With Sequence Diagrams: The profile defines the interfaces used in the sequence interactions. It ensures the method signatures match the boundary contract.
- With Deployment Diagrams: The profile defines the logical nodes that are deployed to physical servers.
This integration ensures that the architecture is consistent across all levels. It prevents the situation where the logical design looks one way, but the physical implementation looks another.
📝 Summary of Value
Visualizing system boundaries through profile diagrams is a foundational practice for robust architecture. It brings clarity to complexity. It reduces ambiguity in team responsibilities. It enforces contracts between services. And it provides a language for discussing the system structure.
By investing time in defining these boundaries correctly, architects can prevent technical debt from accumulating. They can ensure that the system remains maintainable as it grows. They can align business goals with technical constraints. The result is a system that is easier to understand, easier to change, and easier to secure.
As you move forward with your architecture projects, consider the role of the profile diagram. It is not just a drawing; it is a definition of reality for your system. Treat it with the same care and precision as the code itself.