


Unified Modeling Language (UML) provides a standardized notation for specifying, constructing, documenting, and visualizing software-intensive systems. Within this vast ecosystem, the Profile Diagram occupies a unique niche. It is not a diagram that depicts runtime behavior or static structure in the traditional sense. Instead, it acts as an extension mechanism.
This guide explores the technical distinctions between UML Profile Diagrams and standard UML diagram types. We will analyze how profiles define domain-specific modeling languages (DSML) and how they integrate with Class, Sequence, and Component diagrams. Understanding these differences is critical for architects who need to tailor modeling standards without breaking the core UML metamodel.
🔍 What Is a UML Profile Diagram?
A UML Profile is a mechanism for customizing UML for a specific purpose or domain. It is defined in the UML 2.5 specification as an extension of the UML metamodel. While a standard Class Diagram shows objects and relationships, a Profile Diagram defines the vocabulary used to describe those objects within a specific context.
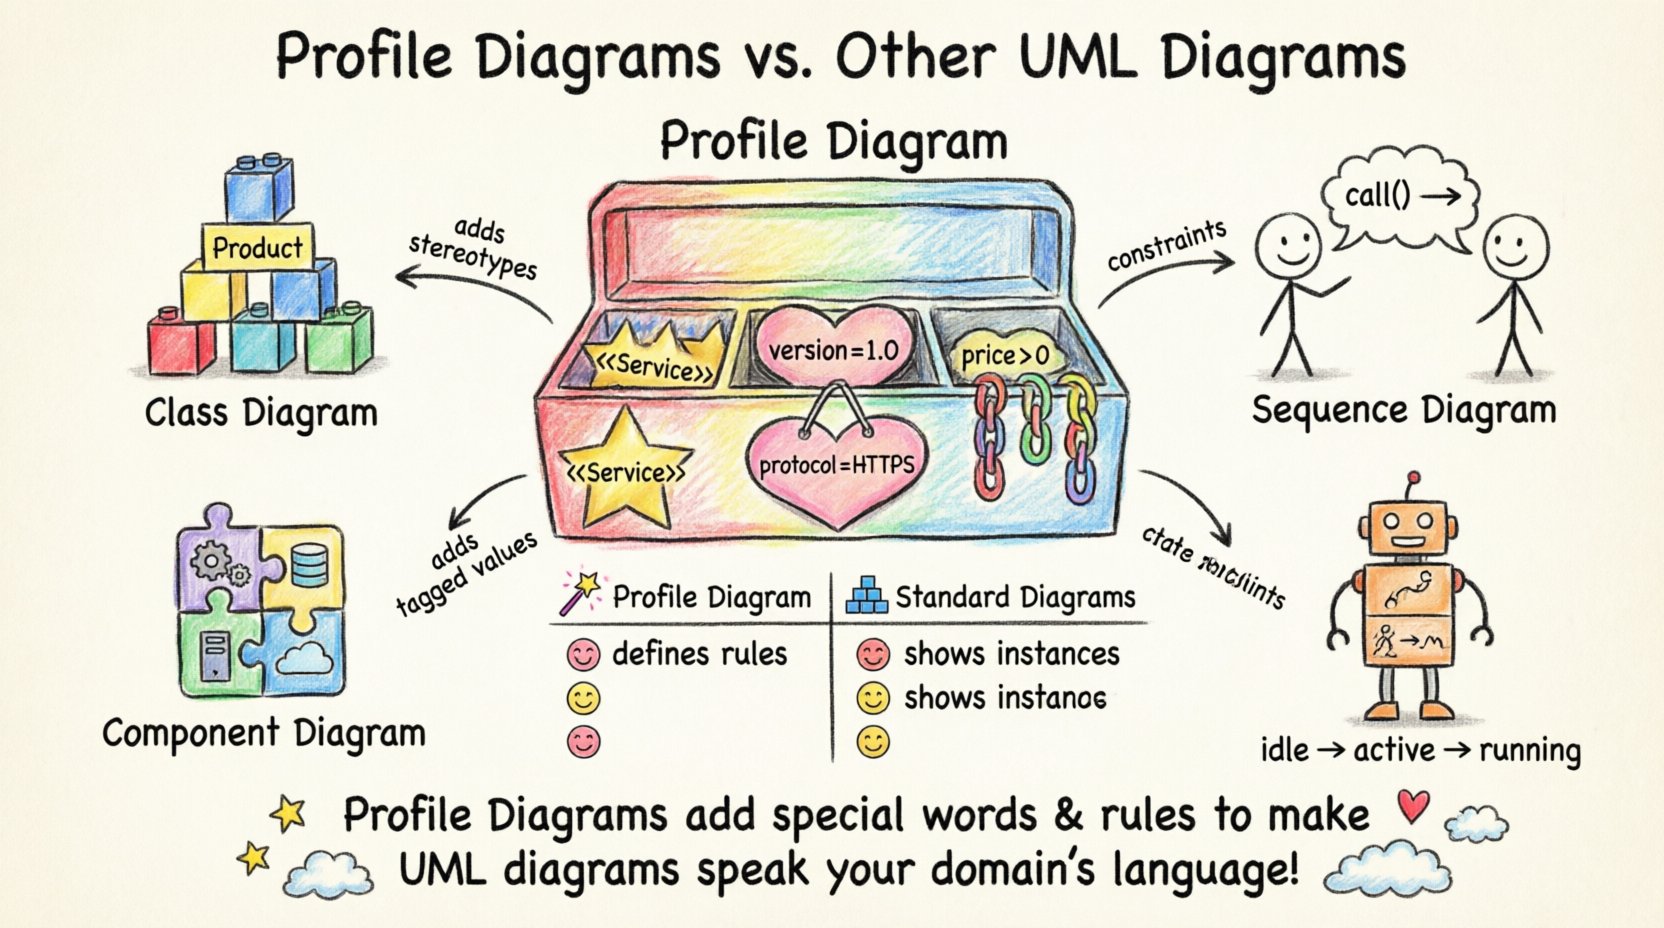
Profiles do not replace standard diagrams. They augment them. Think of a profile as a specialized dictionary added to a language. It introduces new keywords (stereotypes), new properties (tagged values), and new rules (constraints) that apply to existing UML elements.
🛠️ Core Components of a Profile
To understand the comparison, one must first understand the anatomy of a profile. It consists of three primary elements:
- Stereotypes: 🔷 These are the new keywords added to the language. For example, adding a stereotype like
<<Service>>to a class. - Tagged Values: 🏷️ These are named properties attached to stereotypes. They allow for metadata, such as specifying a version number or a protocol type.
- Constraints: ⛓️ These are rules that restrict how elements can be used. They are often written in OCL (Object Constraint Language) or other constraint languages.
When a modeler creates a Profile Diagram, they are essentially building a blueprint for a domain-specific modeling language. This allows teams to create diagrams that speak the specific language of their business domain, rather than generic software engineering terms.
📉 Comparison: Profile Diagrams vs. Standard UML Diagrams
The distinction between a Profile Diagram and other UML diagram types is fundamental. While standard diagrams represent instances of a system, the Profile Diagram represents the rules governing those instances. Below is a detailed breakdown of how they differ in purpose, scope, and usage.
📊 Side-by-Side Comparison Table
| Feature | Profile Diagram | Standard Diagrams (Class, Sequence, etc.) |
|---|---|---|
| Primary Purpose | Define extensions to the UML metamodel. | Model specific system instances or behaviors. |
| Scope | Global or package-level vocabulary. | Local to a specific model or subsystem. |
| Content | Stereotypes, Tagged Values, Constraints. | Classes, Objects, Actors, Messages, States. |
| Dependency | Applied to other diagrams. | Dependent on the metamodel being used. |
| Execution | Cannot be executed directly. | Can be simulated or used for code generation. |
| Visual Representation | Shows definition of stereotypes. | Shows relationships and flow. |
🆚 Profile Diagram vs. Class Diagram
The Class Diagram is the most common UML diagram. It shows the static structure of a system, including classes, interfaces, and their relationships. The Profile Diagram often works in tandem with the Class Diagram, but their roles are distinct.
🏗️ Structural Definition vs. Structural Instance
A Class Diagram models a specific system. For example, a diagram showing the database schema for an e-commerce store. A Profile Diagram, however, defines what a <<Product>> class actually means in that specific domain.
- Class Diagram: Shows that
Producthas anidand aprice. - Profile Diagram: Defines that any class tagged with
<<Product>>must have apricegreater than zero and acurrencytagged value.
Without the Profile, the Class Diagram relies on standard UML semantics. With the Profile, the Class Diagram adheres to industry-specific rules. This is crucial for Model-Driven Architecture (MDA), where code generation depends on strict adherence to the metamodel extensions.
📝 Example Scenario
Consider a medical software system. In a standard Class Diagram, a class might be named Patient. In a specialized Profile Diagram for healthcare, a stereotype <<MedicalRecord>> is defined. When applied to the Class Diagram, it enforces constraints like data privacy compliance.
🆚 Profile Diagram vs. Component Diagram
Component Diagrams focus on the physical or logical components of a system and their dependencies. They are often used for high-level architectural views. The Profile Diagram interacts with Component Diagrams by defining the types of components allowed.
🧩 Defining Component Types
In a generic system, components are just boxes with interfaces. A Profile allows for semantic enrichment.
- Standard Component: A box representing a deployable unit.
- Profiled Component: A box tagged with
<<WebServer>>or<<Database>>.
Using a profile ensures that architects do not misuse components. For instance, a profile might constrain a <<Database>> component to only accept specific connection protocols. This reduces ambiguity during the implementation phase.
🆚 Profile Diagram vs. Sequence Diagram
Sequence Diagrams illustrate how objects interact over time. They focus on the flow of messages. A Profile Diagram influences Sequence Diagrams by defining the nature of the interactions.
🔄 Interaction Semantics
Standard Sequence Diagrams use general messages like request() or response(). A Profile Diagram can introduce domain-specific message types.
- Standard:
sendOrder() - Profiled:
<<SecureTransaction>> sendOrder()
The profile adds semantic weight to the interaction. If a profile defines that all <<SecureTransaction>> messages require encryption, the Sequence Diagram becomes a verification tool for security policies. This is particularly useful in regulated industries like finance or defense.
🆚 Profile Diagram vs. State Machine Diagram
State Machine Diagrams describe the dynamic behavior of a single object. They show states, transitions, and events. A Profile Diagram can extend the State Machine metamodel to support domain-specific states.
⚙️ Behavioral Extensions
Consider a manufacturing system. A standard State Machine might have states like Idle and Running. A Profile Diagram for manufacturing might add a state type <<MaintenanceMode>>.
This extension ensures that all state machines in the project recognize maintenance as a valid, distinct state with specific entry and exit actions. It standardizes the behavior across the entire model without altering the core UML State Machine definition.
🆚 Profile Diagram vs. Activity Diagram
Activity Diagrams model workflows and business processes. They are similar to flowcharts but with UML semantics. Profiles extend Activity Diagrams by defining specific activity types.
🔄 Process Modeling
In a business process, activities are often generic (e.g., Approve). A Profile Diagram can define <<LegalApproval>> or <<FinancialCheck>>.
These stereotypes can carry tagged values regarding time limits, required signatures, or audit trails. When used in an Activity Diagram, these activities trigger specific workflows in the underlying system. This bridges the gap between business requirements and technical execution.
🌍 Domain-Specific Modeling (DSM)
The primary driver for using Profile Diagrams is Domain-Specific Modeling. DSM allows teams to create a modeling language tailored to a specific problem space. Instead of forcing a general-purpose language like UML onto a complex domain, the domain dictates the language.
🚀 Benefits of DSM via Profiles
- Reduced Complexity: Modelers do not need to learn generic UML nuances if the profile simplifies the notation.
- Better Communication: Stakeholders see diagrams that use their terminology, not abstract software terms.
- Automation: Code generators can map profile elements directly to framework-specific code.
🚫 Challenges of DSM
- Tooling Support: Not all modeling tools support profile creation or extension equally.
- Versioning: Managing updates to a profile across multiple models requires strict governance.
- Learning Curve: Teams must learn the profile definition, not just the application.
🛠️ Implementation Strategy
Creating a Profile Diagram is a deliberate architectural decision. It should not be done lightly. The process involves defining the metamodel extension, applying it to packages, and documenting the constraints.
📝 Step-by-Step Process
- Identify the Need: Determine if standard UML elements are insufficient for the domain.
- Define Stereotypes: Create new keywords that add meaning to existing elements.
- Add Tagged Values: Attach metadata to these stereotypes to capture specific requirements.
- Write Constraints: Use OCL or similar languages to enforce rules.
- Apply to Models: Attach the profile to specific packages within the model.
- Validate: Ensure the model adheres to the profile constraints.
🔄 Integration with Standard Diagrams
Profiles are not isolated. They must integrate seamlessly with standard diagrams. The integration happens at the metamodel level.
🔗 Metaclass Extension
When you create a stereotype for a Class, you are extending the Class metaclass. This means the stereotype appears in the Class Diagram. The Profile Diagram is where this extension is defined.
This relationship ensures consistency. If you change a stereotype definition in the Profile Diagram, that change propagates to all Class Diagrams using that profile. This centralized management is a key advantage of the profile mechanism.
📉 Common Pitfalls
While powerful, Profile Diagrams introduce complexity if misused.
⚠️ Over-Engineering
Do not create profiles for every minor variation. If a standard UML element suffices, use it. Creating a profile for a simple variation can lead to unnecessary maintenance overhead.
⚠️ Inconsistent Naming
Ensure stereotypes follow a consistent naming convention. Confusing names make models hard to read and maintain. Use clear, domain-relevant terms.
⚠️ Tooling Limitations
Some tools struggle with profile validation. Verify that your modeling environment can enforce constraints defined in the profile before committing to the approach.
📈 Best Practices for Maintenance
Once a profile is established, it becomes part of the project’s infrastructure. It requires the same version control and documentation as the code itself.
📂 Documentation
Every stereotype should have a description. What does it mean? What tagged values are required? This documentation is vital for new team members.
🔄 Version Control
Treat the profile as a library. When changes are made, version them. If a project relies on Profile V1, do not force an upgrade to V2 without testing.
🔍 Review Cycles
Include profile definitions in architectural review cycles. Ensure that the profile is still serving its purpose and not becoming a barrier to modeling.
🔮 Future Trends in Modeling
The use of profiles is likely to grow as systems become more complex. As Model-Driven Engineering (MDE) matures, the ability to define custom languages will become standard practice.
🤖 AI-Assisted Modeling
Future tools may use AI to suggest profile extensions based on code analysis. This could automate the creation of profiles that match existing codebases.
🌐 Cloud-Native Profiles
With the rise of microservices, profiles will likely evolve to define cloud-native patterns. Concepts like <<Container>> or <<ServerlessFunction>> are already emerging in industry standards.
🧩 Summary of Differences
To recap, the Profile Diagram serves a meta-level function. It defines the rules, not the data. Other UML diagrams represent the data and behavior within those rules.
- Class Diagram: Shows structure.
- Sequence Diagram: Shows interaction.
- Profile Diagram: Shows the vocabulary for structure and interaction.
Using a Profile Diagram allows for precision in modeling. It ensures that everyone on the team speaks the same language, reducing ambiguity and errors in the final system.
🎯 Final Considerations
Choosing between standard diagrams and profile extensions depends on the complexity of the domain. For simple systems, standard UML is often sufficient. For complex, regulated, or highly specialized domains, the Profile Diagram is an essential tool.
By understanding the mechanics of stereotypes, tagged values, and constraints, architects can build modeling environments that are both flexible and rigorous. This balance is key to successful software architecture.
Remember that the goal is not to complicate the process but to clarify it. Profiles should make the model easier to understand for the domain experts, not harder to read for the modelers. When implemented correctly, they bridge the gap between abstract design and concrete implementation.
As you plan your next modeling initiative, evaluate whether your current diagrams capture the necessary domain semantics. If not, consider developing a custom profile. This investment in the metamodel will pay dividends in clarity, maintainability, and automation throughout the software development lifecycle.