


In the fast-paced environment of modern software engineering, documentation often gets sidelined in favor of code. However, the complexity of distributed systems requires more than just implementation logic. It requires a clear architectural understanding that persists beyond a single sprint. This is where the Profile Diagram becomes a critical asset. While Agile methodologies emphasize working software over comprehensive documentation, they do not preclude the necessity of visual models that clarify system boundaries and capabilities.
Profile Diagrams, a specialized type of diagram within the Unified Modeling Language (UML) and Systems Modeling Language (SysML) frameworks, offer a way to define the semantics of a modeling language. In the context of Agile Software Development, these diagrams serve as a shared language. They bridge the gap between high-level architectural intent and the iterative delivery of user stories. Understanding their role is essential for teams aiming to maintain technical debt at bay while adhering to iterative timelines.
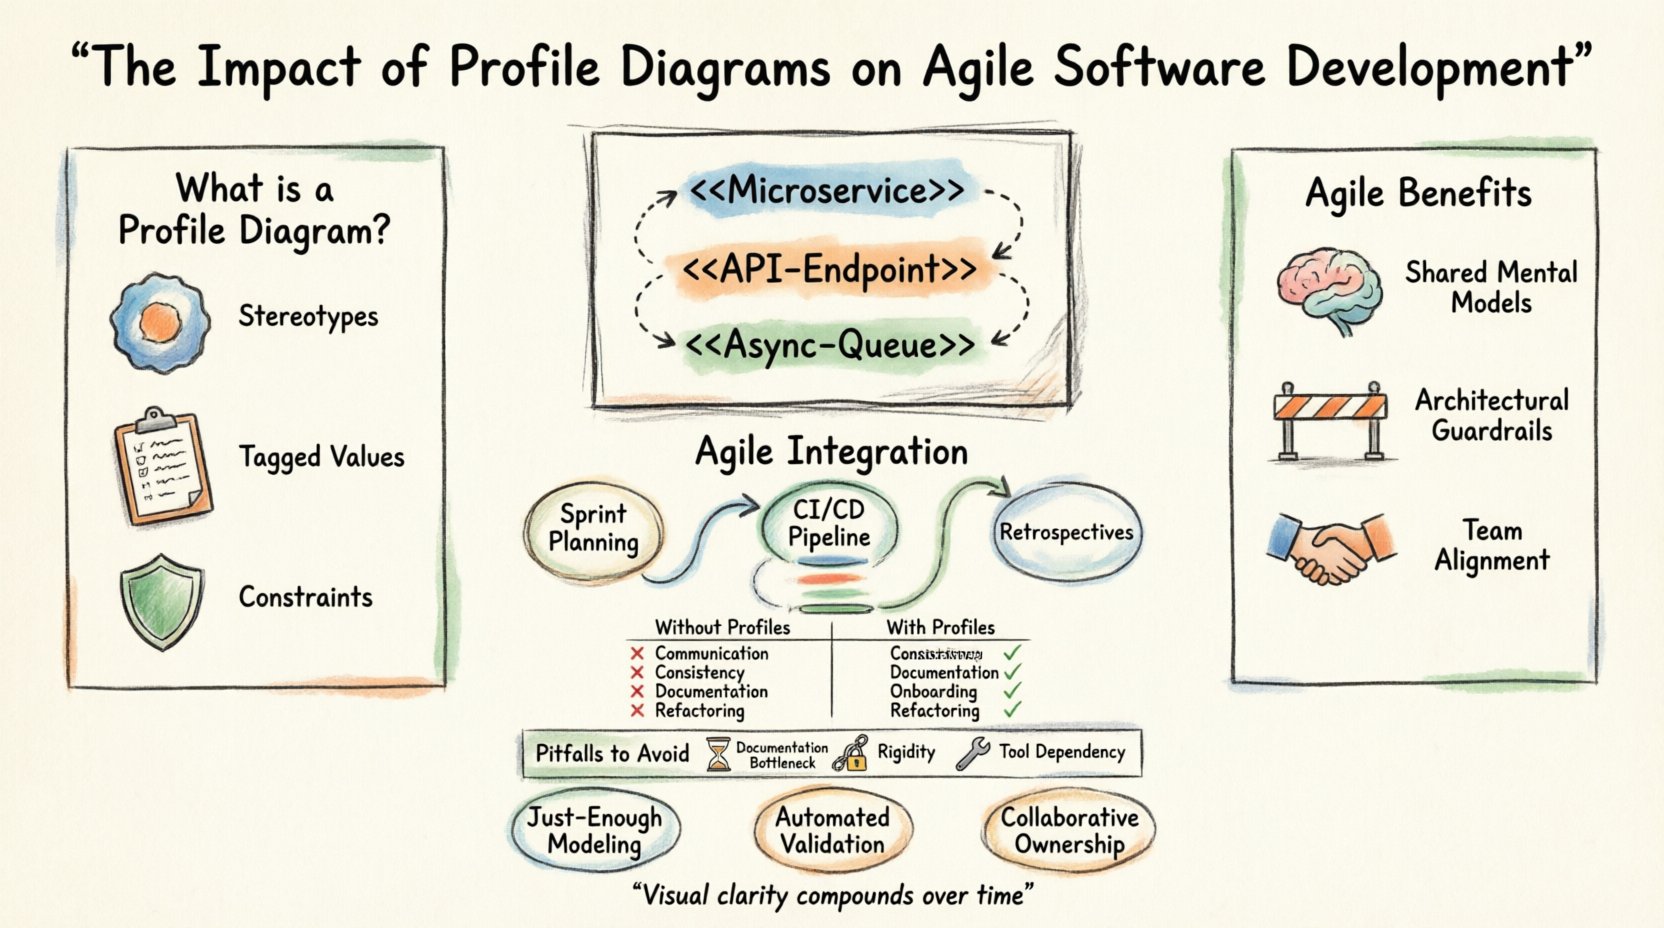
Understanding Profile Diagrams 📐
A Profile Diagram is not a standard structural diagram like a Class or Sequence diagram. Instead, it is a mechanism for extending the modeling language itself. It defines stereotypes, tagged values, and constraints that apply to specific domains. Think of it as a vocabulary builder for your architecture.
When a team adopts a specific set of architectural patterns, they need a consistent way to denote them. A Profile Diagram allows the modeling tool or the team to define custom elements. For example, a team might define a stereotype called <<Microservice>> or <<API-Endpoint>>. This adds semantic meaning to the model without altering the core language.
- Stereotypes: These are the core elements added to the language. They allow developers to label elements in a specific way relevant to their domain.
- Tagged Values: These provide additional metadata to elements. A service might have a tag for “Latency Tolerance” or “Data Sensitivity”.
- Constraints: These define rules that must be followed. For instance, a constraint might dictate that all database services must be read-only replicas unless explicitly tagged otherwise.
By establishing these definitions early, the team ensures that every diagram created later carries the correct context. This reduces ambiguity during code reviews and design discussions.
Why Agile Teams Need Visual Models 🧩
Agile frameworks like Scrum or Kanban prioritize adaptability. Requirements change frequently. Documentation that is too rigid becomes obsolete quickly. However, the architecture of a system often remains stable even when features change. Visual models help capture this stability.
Profile Diagrams fit into Agile because they are lightweight compared to full architectural blueprints. They define the rules of the game rather than the state of the game. This distinction is vital for iterative development.
1. Shared Mental Models 🧠
One of the biggest challenges in Agile is ensuring that all team members, from developers to testers to product owners, understand the system in the same way. A Profile Diagram acts as a reference point. When a new developer joins a sprint, they can look at the profile to understand what a <<Transaction>> entails in this specific system.
- Onboarding Speed: New hires can grasp the domain language faster.
- Reduced Miscommunication: Terms are standardized, reducing the risk of implementation errors.
- Cross-Team Alignment: Different squads working on the same platform can use the same profiles to ensure compatibility.
2. Architectural Guardrails 🚧
Agile does not mean anarchy. There are non-functional requirements that must be met, such as security, performance, and scalability. Profile Diagrams can enforce these requirements visually.
If a team defines a constraint that all external services must authenticate via OAuth 2.0, this constraint is visible in the model. It guides the development process without requiring a separate policy document. The model becomes the policy.
Integration with Agile Practices 🔄
Integrating modeling into Agile requires a shift in mindset. The diagram is not a deliverable to be signed off at the start of a project. It is a living artifact that evolves with the software.
1. Sprint Planning and User Stories 📝
During sprint planning, user stories are broken down into tasks. Profile Diagrams can help define the technical scope of these tasks. For instance, a story about adding a new payment method might require creating a new profile element to represent that payment type.
This ensures that the implementation aligns with the overall architectural profile. It prevents the creation of ad-hoc solutions that deviate from the established patterns.
2. Continuous Integration and Deployment 🚀
In a DevOps pipeline, configuration management is key. Profile Diagrams can define the templates for infrastructure as code. By mapping the profile elements to infrastructure definitions, teams can automate the provisioning of compliant resources.
This creates a feedback loop where the code must match the model. If the code violates a profile constraint, the build can fail, ensuring architectural integrity is maintained automatically.
3. Retrospectives 📊
During retrospectives, teams often discuss technical debt. Profile Diagrams provide a clear way to identify where the system is drifting. If the actual implementation no longer matches the defined stereotypes, the diagram highlights the discrepancy.
- Identify Drift: Spot areas where custom code ignores standard profiles.
- Refactor Plans: Prioritize refactoring efforts based on profile violations.
- Update Profiles: If the architecture evolves, update the profile to reflect the new reality.
Benefits of Visual Context in Iterative Development ⚖️
The use of Profile Diagrams brings specific advantages to the iterative nature of Agile. These benefits are not just theoretical; they impact velocity and quality directly.
| Aspect | Without Profile Diagrams | With Profile Diagrams |
|---|---|---|
| Communication | Relies on verbal explanations and code reading. | Standardized visual symbols reduce ambiguity. |
| Consistency | Patterns vary between developers and teams. | Enforces a unified set of stereotypes and constraints. |
| Documentation | Often outdated or missing due to time pressure. | Focused on structural rules rather than transient state. |
| Onboarding | Requires reading extensive codebases to understand context. | Provides immediate context through defined profiles. |
| Refactoring | Risky due to unknown dependencies and patterns. | Clear rules help identify safe refactoring paths. |
Common Pitfalls in Modeling for Speed ⚠️
While the benefits are clear, introducing modeling into Agile comes with risks. Teams must avoid the trap of over-engineering the documentation process.
1. The Documentation Bottleneck 🚫
The most common mistake is treating the diagram as a prerequisite for coding. In Agile, code drives the design. If the team spends two weeks drawing diagrams before writing a line of code, they are not being Agile.
- Mitigation: Update the profile diagram as you write code. Treat the diagram as a byproduct of implementation.
- Mitigation: Keep diagrams high-level. Do not model every class detail.
2. Rigidity and Inflexibility 🪵
Profiles define rules, but sometimes those rules need to change. If a team is too attached to the initial profile, they may resist necessary architectural pivots.
- Mitigation: Review profiles regularly. Treat them as living documents that evolve with the product.
- Mitigation: Allow exceptions. Not every service needs to fit every stereotype.
3. Tool Dependency 🛠️
Using complex modeling tools can slow down the team. If the tool requires heavy setup or is difficult to use, adoption will fail.
- Mitigation: Choose tools that integrate with the existing development environment.
- Mitigation: Use simple formats (like text-based definitions) where possible.
Strategies for Sustainable Documentation 📝
To make Profile Diagrams work in an Agile environment, specific strategies must be employed. The goal is to maintain value without creating overhead.
1. Just-Enough Modeling 🧱
Do not model everything. Model the parts of the system that are complex or critical. Simple CRUD operations do not need a profile definition. Focus on the areas where ambiguity exists.
- Identify high-risk areas.
- Define profiles only for complex integrations.
- Leave simple logic to code comments.
2. Automated Validation 🤖
Manual checks are prone to error. Use scripts or plugins to validate that the code matches the profile definitions. This keeps the team honest without requiring manual audits.
- Automated linting for architectural rules.
- CI/CD checks that verify stereotype usage.
- Static analysis tools that read model definitions.
3. Collaborative Ownership 👥
Documentation should not be the sole responsibility of the architects. The whole team should own the profile.
- Encourage developers to suggest profile updates.
- Make changes to the profile part of the Definition of Done.
- Review profile changes in the same meetings as code changes.
The Role of Architecture in Continuous Delivery 🚢
Continuous Delivery relies on speed and reliability. Architecture is the foundation of both. Profile Diagrams support this by ensuring that every deployment adheres to the established standards.
When a new feature is deployed, it must fit into the existing ecosystem. Profile Diagrams make it clear how the new feature interacts with existing services. This reduces the risk of breaking changes and integration failures.
In a microservices environment, for example, a Profile Diagram can define the contract between services. It specifies the expected input and output formats, the error handling patterns, and the authentication requirements. This contract is visible to all teams, reducing the need for synchronous communication during the development process.
Team Dynamics and Shared Understanding 🤝
Software development is a social activity. Teams interact with each other constantly. Profile Diagrams facilitate this interaction by providing a common vocabulary.
When a backend team says, “This endpoint uses the <<Async-Queue>> profile,” the frontend team immediately understands the behavior. They know they do not need to wait for a synchronous response. They know to handle eventual consistency.
This shared understanding reduces the need for meetings and clarifies expectations. It allows teams to work in parallel with a higher degree of confidence. The diagram acts as a contract that is visible to everyone.
Maintenance and Evolution of Diagrams 🔁
Like code, diagrams rot. If they are not maintained, they become misleading. Maintaining a Profile Diagram requires discipline.
Every time the architecture changes, the profile should be reviewed. Is the stereotype still relevant? Are the constraints still valid? If the system has evolved, the profile must evolve with it.
Version control is essential for diagrams. Just as code is stored in a repository, diagrams should be too. This allows teams to track changes over time and revert if a change introduces errors.
- Versioning: Treat diagrams as code.
- Review: Include diagrams in pull requests.
- Deprecation: Mark old stereotypes as deprecated before removing them.
Future Trends in Modeling and Agile 🌐
The landscape of software development is changing. Artificial Intelligence and Machine Learning are beginning to influence how models are generated and maintained.
In the future, Profile Diagrams might be generated automatically from code analysis. Tools could infer stereotypes based on usage patterns. This would reduce the manual effort required to maintain the diagrams.
However, the human element remains critical. AI can suggest profiles, but humans must define the intent. The strategic decisions about what the system should look like still require human judgment. The Profile Diagram remains a tool for expressing that intent.
As systems become more distributed and cloud-native, the need for clear architectural definitions increases. Profile Diagrams will likely become more central to how teams manage complexity, even in the most agile environments.
Conclusion
The integration of Profile Diagrams into Agile Software Development offers a structured approach to managing complexity without sacrificing speed. By defining the vocabulary and rules of the architecture, teams can communicate more effectively and maintain consistency across iterations.
Success depends on balance. The diagrams must be useful, not burdensome. They should guide the team, not constrain them. When implemented correctly, Profile Diagrams become a silent partner in the development process, ensuring that the software built today aligns with the architecture planned for tomorrow.
Teams that invest in this visual clarity will find that their velocity improves over time. The initial effort in defining the profiles pays dividends in reduced confusion, fewer defects, and smoother collaboration. In the long run, the clarity provided by a well-maintained Profile Diagram is an asset that compounds, supporting the growth of the software and the team alike.