


Software architecture relies heavily on visual communication. When developers and stakeholders need to understand how a complex system is built internally, Composite Structure Diagrams provide the necessary clarity. These diagrams show the internal structure of a class or component, revealing the parts that make up the whole. You do not need specialized tools or years of training to begin working with them.
This guide walks you through the fundamental concepts, notation, and creation processes. We will break down the syntax and provide practical steps to model your own system structures. By the end, you will understand how to visualize the relationships between parts and roles within a composite unit.
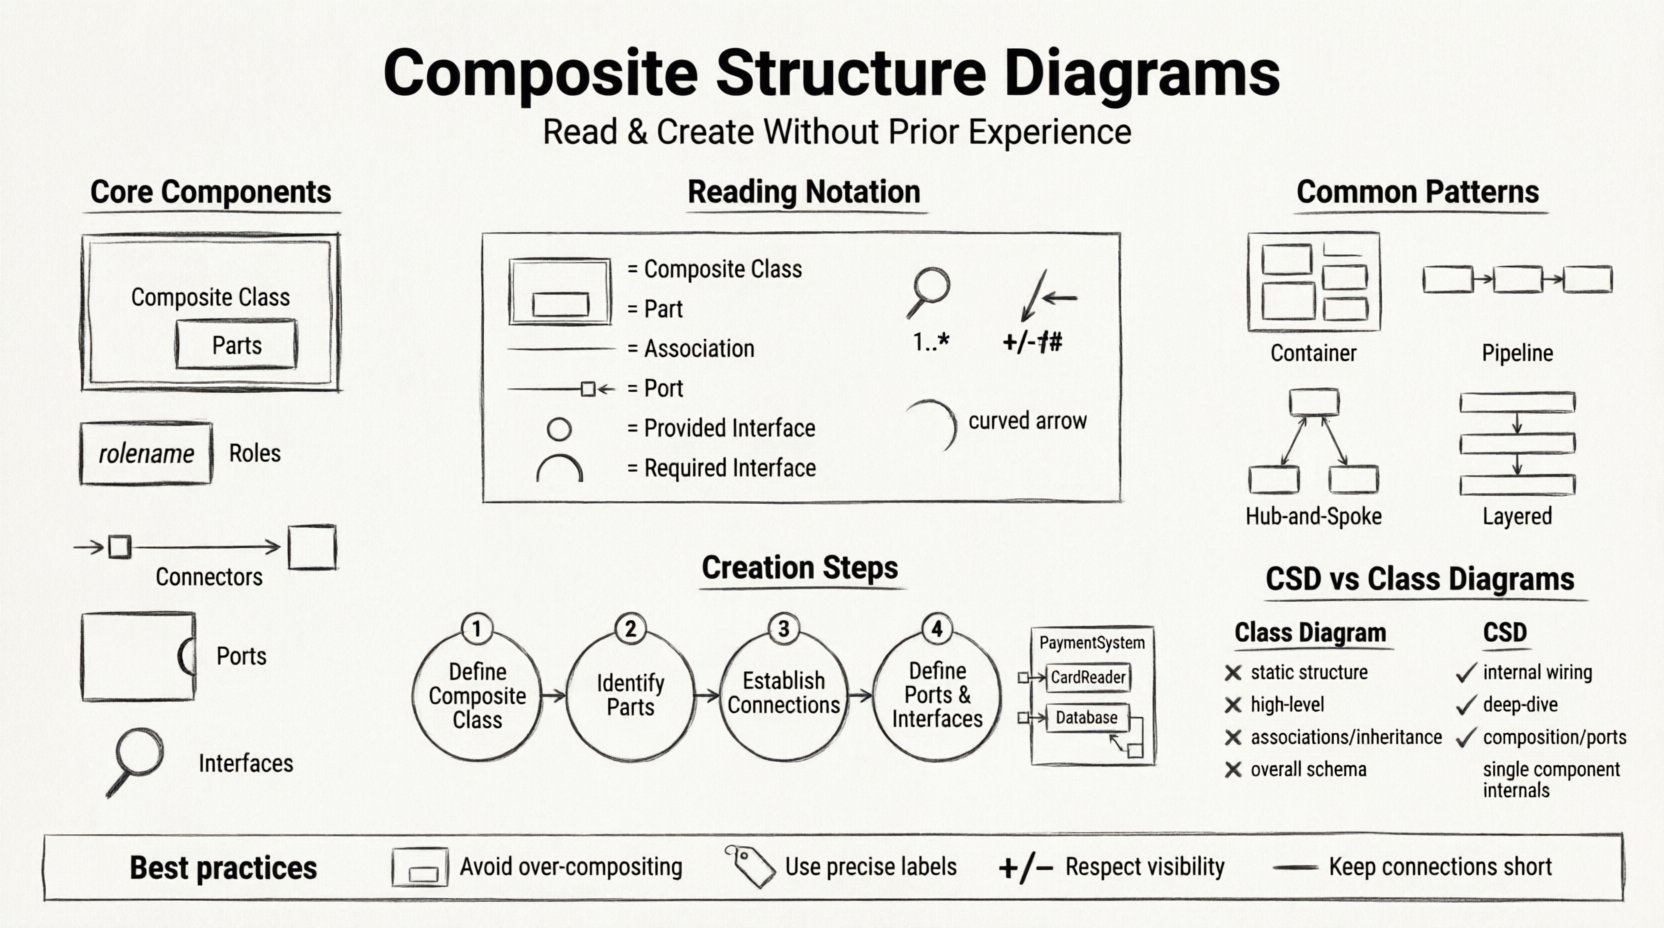
🧩 Understanding the Core Components
Before drawing lines and boxes, you must understand the vocabulary of the diagram. A Composite Structure Diagram focuses on the internal composition of a classifier. It breaks down a complex entity into smaller, manageable units.
Here are the essential elements you will encounter:
- Composite Class: The main container or the “whole” being described. This is the outer box that holds everything else.
- Parts: These are the internal components. They represent the pieces that make up the composite class.
- Roles: A part plays a specific role within the composite. The same part can play different roles in different contexts.
- Connectors: Lines that link parts together, showing how data or control flows between them.
- Ports: These are interaction points on the edge of a part. They define where external communication enters or leaves the part.
- Interfaces: Defined contracts that specify what a part can do or what it needs from another part.
Visualizing these elements helps you see the system as a hierarchy. Instead of looking at a single block of code, you see the machinery inside.
🔍 Reading the Diagram: Notation and Syntax
Interpreting an existing diagram requires attention to detail. The notation is standardized, but understanding the specific layout is key. When you look at a composite structure diagram, you are looking for the internal wiring of a class.
Consider the following breakdown of standard symbols:
| Symbol | Meaning |
|---|---|
| Box with a double line | Represents the Composite Class (the whole) |
| Smaller box inside | Represents a Part or Component |
| Line connecting parts | Represents an Association or Link |
| Small square on a connector | Represents a Port |
| Interface Lollipop | Represents a Provided Interface |
| Interface Half-Circle | Represents a Required Interface |
When reading, start from the top. Identify the main composite class. Then, trace the parts inside it. Look for the ports to understand external dependencies. Notice the labels on the connectors; they indicate the nature of the relationship, such as composition or aggregation.
Key Reading Tips:
- Check Multiplicity: Look for numbers near the connector ends. A “1” means one instance, while a “*” means many. This defines the cardinality of the relationship.
- Identify Visibility: Symbols like
+,-, and#indicate public, private, and protected access levels for the parts. - Follow the Flow: Trace the lines from ports to ports. This shows how information moves through the internal structure.
🛠 Creating Your Own Diagram: A Step-by-Step Approach
Building a diagram from scratch does not require guesswork. It follows a logical decomposition process. You begin with a high-level view and drill down into the details.
Step 1: Define the Composite Class
Start by identifying the system element you want to model. Is it a specific class in your codebase? Is it a subsystem? Write the name clearly in the main box. This establishes the scope of your diagram.
Step 2: Identify the Parts
List the internal components required to make this composite function. Ask yourself: “What smaller pieces does this need?” These could be other classes, modules, or hardware components. Draw boxes for each part inside the main composite box.
- Use descriptive names for clarity.
- Group related parts together visually if possible.
- Ensure every part serves a purpose within the whole.
Step 3: Establish Connections
Draw lines between the parts. These lines represent associations. They show that the parts interact with each other. Ensure the direction of the relationship is clear. If data flows from Part A to Part B, the arrow should point to Part B.
Step 4: Define Interfaces and Ports
Not all interactions happen internally. Some parts need to communicate with the outside world. Add ports to the edges of the parts. Define interfaces to specify what functionality is offered or needed.
Example Scenario:
Imagine a PaymentSystem composite. It needs a CardReader part and a Database part. The CardReader requires a validation interface. The Database provides a storage interface. You would draw the PaymentSystem box, place the two parts inside, add a port to the CardReader for the input, and connect it to the Database for storage.
🔄 Common Patterns and Structural Relationships
Certain patterns emerge frequently when modeling complex systems. Recognizing these patterns helps you structure your diagrams more effectively.
1. The Container Pattern
This is the most common structure. A main class contains several smaller components that work together to provide a single service. The internal parts are hidden from the outside world, accessible only through the composite’s public interface.
2. The Pipeline Pattern
Parts are connected in a sequence. Data enters the first part, is processed, passed to the next, and so on. This is common in data processing workflows. Each part handles a specific stage of the transformation.
3. The Hub-and-Spoke Pattern
One central part connects to multiple peripheral parts. The central part manages the coordination. This is useful for controllers or managers that oversee various subsystems.
4. The Layered Pattern
Parts are arranged in layers. The top layer depends on the one below it, but not vice versa. This enforces a strict separation of concerns, often seen in network or application architectures.
📊 Comparison: CSD vs. Class Diagrams
It is easy to confuse Composite Structure Diagrams with Class Diagrams. Both deal with classes and relationships, but their focus differs significantly.
| Aspect | Class Diagram | Composite Structure Diagram |
|---|---|---|
| Focus | Static structure of classes and attributes | Internal structure of a specific classifier |
| Detail Level | High-level overview of the system | Deep dive into one component’s internals |
| Relationships | Associations, Inheritance, Aggregation | Composition, Collaboration, Ports |
| Use Case | Designing the overall schema | Designing the internal wiring of a class |
Use a Class Diagram to map out the entire project’s classes. Use a Composite Structure Diagram when you need to explain how a specific, complex class is built from the inside out.
⚠️ Common Pitfalls and Best Practices
Creating these diagrams can be deceptively simple. Without discipline, they can become cluttered and confusing. Follow these guidelines to maintain clarity.
Do Not Over-Composite
There is a limit to how much detail you should show. If a composite class is too complex, consider breaking it down into smaller composites. A diagram with too many parts inside a single box becomes unreadable.
Avoid Ambiguous Labels
Labels should be precise. Instead of “Data,” use “User Credentials.” Instead of “Logic,” use “Validation Logic.” Specificity reduces cognitive load for the reader.
Respect Visibility
Do not show private internal parts unless necessary for a specific technical explanation. Public interfaces should be the primary focus of external communication.
Keep Connections Short
Long, crossing lines make the diagram hard to follow. Arrange parts logically so that connectors are short and direct. If parts are far apart, consider grouping them visually.
Document the Notation
Even if the notation is standard, include a legend if you use custom symbols or specific notations for your team. This ensures everyone interprets the diagram the same way.
🎯 Practical Application Scenarios
Where do these diagrams fit into the real world? They are valuable in several contexts.
- Legacy System Migration: When moving from old architecture to new, these diagrams help document the internal logic of monolithic blocks.
- API Design: They clarify how internal modules interact with external API endpoints.
- Hardware Integration: They show how software components map to physical hardware parts.
- Team Onboarding: New developers can understand the internal structure of a module without reading every line of code.
🚀 Moving Forward
Mastering the visual language of software architecture takes time. Start with simple examples. Draw the structure of a basic calculator or a login form. Focus on the parts and their connections.
As you gain confidence, tackle more complex systems. The goal is not perfection in the first attempt, but clarity in communication. These diagrams serve as a bridge between technical implementation and business understanding.
Remember that the diagram is a living document. As the system evolves, the diagram should change with it. Keep it updated to remain a useful reference for your team. With practice, reading and creating these structures will become a natural part of your design process.
By focusing on the internal composition of your classes, you gain a deeper understanding of system cohesion. This leads to more maintainable code and clearer documentation. You are now equipped with the knowledge to visualize the unseen parts of your architecture.