


In the complex landscape of system architecture and software modeling, clarity is paramount. A profile diagram serves as a critical mechanism for extending modeling languages to fit specific domain needs. These diagrams allow architects to define new concepts without altering the core language syntax. This article explores the trajectory of profile diagrams, from their early conceptualization to modern applications in cloud-native and AI-driven environments. 🏗️
🏛️ Historical Context: The Pre-Standardization Era
Before the widespread adoption of unified modeling standards, software architecture relied heavily on bespoke notations. Teams created their own visual languages to represent data flows, class structures, and process logic. While effective for small teams, this approach led to fragmentation when projects scaled. The need for a common ground became evident in the late 1980s and early 1990s.
During this period, several methodologies competed for dominance, including OMT, OOSE, and Booch method. Each used different symbols and terminology. The industry recognized that a lack of standardization hindered communication between developers, analysts, and stakeholders. This friction drove the formation of the Object Management Group (OMG) and the subsequent creation of the Unified Modeling Language (UML).
Initially, UML focused on a fixed set of diagrams. However, practitioners soon realized that a static language could not address every unique industry requirement. Software engineering domains like embedded systems, telecommunications, and enterprise resource planning required specialized extensions. This necessity birthed the concept of the Profile Diagram. 📝
🔄 The UML Standardization and Profile Introduction
The formal introduction of profiles occurred within the UML 2.0 specification. This update was a significant milestone because it moved from a rigid set of rules to a flexible, extensible framework. A profile acts as a specialization mechanism. It allows users to define new metaclasses and link them to existing core elements.
Key characteristics of this era included:
- Standardization: Profiles became part of the official UML specification, ensuring interoperability across different modeling environments.
- Stereotypes: The primary tool for extension. Stereotypes allow modelers to tag elements with custom meanings (e.g., <<Service>>, <<Database>>).
- Tagged Values: Mechanisms to attach specific data attributes to model elements, such as version numbers or deployment targets.
- Constraints: Rules that enforce logical boundaries within the model, ensuring data integrity.
This era marked the transition from purely visual representation to semantic modeling. Architects could now encode business logic directly into the structure of the diagram.
🧩 Anatomy of a Modern Profile Diagram
Understanding the internal structure of a profile diagram is essential for effective modeling. A well-constructed diagram provides a blueprint for how a specific domain interprets the core language. The following components form the backbone of any robust profile:
1. Stereotypes
Stereotypes are the cornerstone of profile diagrams. They extend the vocabulary of the language. Instead of using a generic “Class” or “Component,” a domain expert might use a “BankAccount” or “PaymentGateway.” This reduces cognitive load for the reader.
2. Tagged Values
While stereotypes define the type, tagged values define the properties. For instance, a server component might have a tagged value for “OperatingSystem” or “MemorySize.” This moves specific configuration details into the design phase, reducing ambiguity during implementation.
3. Constraints
Constraints add logic to the visual model. They can be expressed in natural language or formal languages like OCL (Object Constraint Language). For example, a constraint might state that a specific service cannot communicate directly with a legacy database.
4. Profiles and Package Dependencies
Profiles are often organized into packages to manage complexity. Dependencies between profiles allow for the inheritance of concepts. This hierarchical structure ensures that changes in a base profile propagate correctly to derived profiles.
📊 Evolution Timeline Comparison
| Phase | Focus Area | Key Capability | Limitation |
|---|---|---|---|
| Pre-UML (1990s) | Bespoke Notations | High Flexibility | Low Interoperability |
| UML 1.x | Standardized Syntax | Common Vocabulary | Limited Extensibility |
| UML 2.0+ | Profile Extensions | Stereotypes & Tagged Values | Complexity in Management |
| Modern Era | Domain Specific Models | Integration with Code & Cloud | Tooling Fragmentation |
🌐 Emerging Trends in Profile Diagrams
As technology landscapes shift, the role of profile diagrams is adapting. The following trends are shaping the future of system modeling.
1. Cloud-Native Architectures
The shift from monolithic applications to microservices has changed how profiles are defined. Traditional diagrams often struggled to represent dynamic scaling and ephemeral resources. Modern profiles now incorporate concepts like:
- Containerization: Defining resources as Docker containers or Kubernetes pods within the model.
- Service Meshes: Visualizing traffic flow and security policies between services.
- Serverless Functions: Modeling event-driven triggers without explicit server infrastructure.
2. Model Driven Engineering (MDE)
Profile diagrams are increasingly used as the source of truth for code generation. In MDE, the diagram is not just documentation; it is executable logic. This approach reduces the gap between design and deployment. When a profile is updated, the generated code reflects those changes automatically.
3. Semantic Web Integration
There is a growing movement to link profile diagrams with semantic data standards. By mapping diagram elements to ontologies, models become queryable and interoperable with external data sources. This enhances the ability to perform automated analysis and compliance checking.
4. AI-Assisted Modeling
Artificial intelligence is beginning to influence how profiles are constructed. AI tools can analyze existing codebases and suggest appropriate stereotypes. They can also detect inconsistencies in tagged values. This automation helps maintain high-quality models without excessive manual overhead.
🛠️ Challenges in Profile Management
Despite the benefits, implementing profile diagrams comes with challenges. Organizations must navigate several pitfalls to ensure success.
- Version Control: Managing changes to profiles across large teams is difficult. A change in a base stereotype can ripple through the entire system.
- Documentation Overhead: Profiles require clear documentation. If the meaning of a stereotype is unclear, the diagram loses value.
- Tooling Support: Not all modeling tools support profile extensions equally. Some may render them as generic shapes, losing the intended semantic meaning.
- Learning Curve: Team members must understand the difference between core UML elements and profile-specific extensions. Training is essential.
🚀 Best Practices for Implementation
To maximize the utility of profile diagrams, adhere to the following guidelines.
Define Clear Conventions
Establish a naming convention for stereotypes and tagged values. Consistency is key to readability. Avoid creating overly complex profiles that attempt to solve every problem. Focus on the specific domain needs.
Maintain Separation of Concerns
Keep the core model separate from the profile extensions. This allows the core logic to remain stable while the profile evolves to meet new requirements. It also ensures that the model remains valid even if the profile is temporarily unavailable.
Automate Validation
Use scripts or tools to validate the consistency of tagged values. Automated checks prevent human error and ensure that the model adheres to architectural standards.
Iterate and Refine
Profiles are not static artifacts. They should evolve alongside the software. Regular reviews of the profile structure ensure it remains relevant to the current technology stack.
🔮 Future Outlook
The trajectory of profile diagrams points towards greater automation and integration. As systems become more distributed, the need for clear architectural semantics increases. We can expect to see more integration between modeling tools and development pipelines.
Furthermore, the rise of low-code and no-code platforms relies heavily on predefined profiles. These platforms abstract the complexity of the underlying code by providing high-level profile abstractions. This democratizes architecture design, allowing non-technical stakeholders to participate in the modeling process.
The evolution continues. From simple hand-drawn sketches to complex, executable models, profile diagrams have matured into a sophisticated tool for system definition. Their ability to adapt to new paradigms ensures their place in the future of software engineering. 🚀
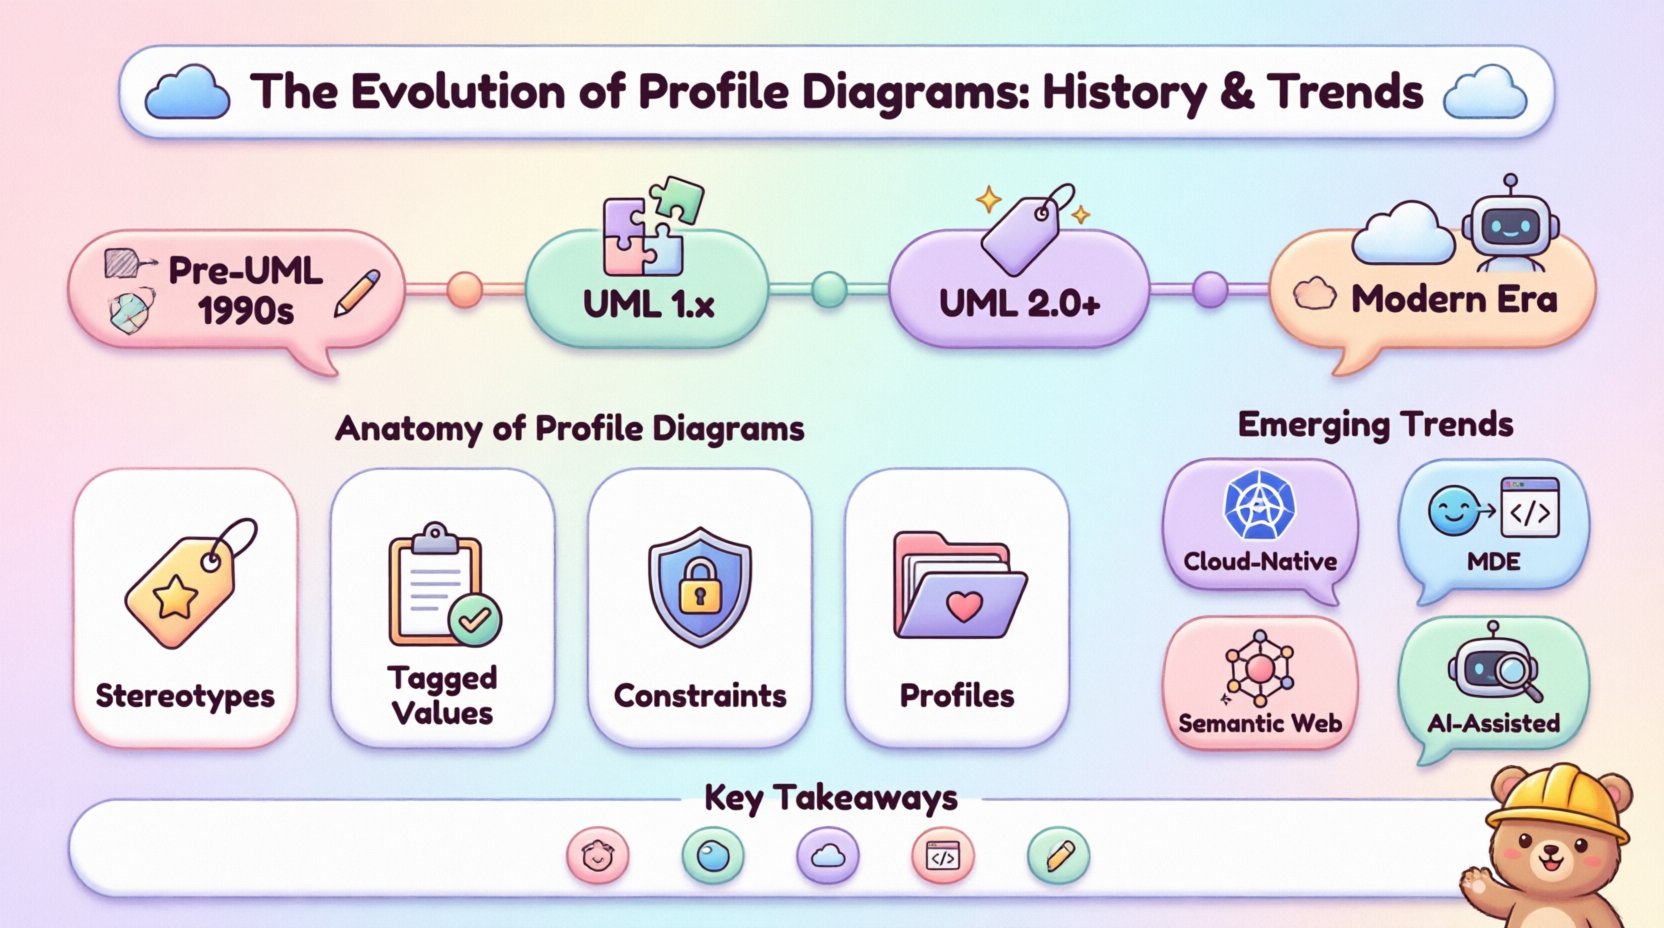
📝 Summary of Key Takeaways
- Profile diagrams extend modeling languages to fit specific domain needs.
- UML 2.0 formalized the use of stereotypes and tagged values.
- Modern trends include cloud-native support and AI integration.
- Effective management requires version control and clear conventions.
- Profiles are dynamic artifacts that evolve with the software.
By understanding the history and embracing emerging trends, architects can leverage profile diagrams to build more robust, maintainable, and scalable systems. The journey from static diagrams to dynamic models is ongoing, and the profile remains a central pillar in this evolution. 🛡️