


Software architecture is not merely about writing code; it is about defining the relationships, boundaries, and internal mechanics of a system. For technical leads, choosing the right modeling language is a critical decision that impacts clarity, maintainability, and team alignment. Two of the most prominent UML diagrams often cause confusion: the Class Diagram and the Composite Structure Diagram.
While both describe structure, they operate at different levels of abstraction. A Class Diagram focuses on static relationships between types, whereas a Composite Structure Diagram exposes the internal parts and connections within a classifier. Understanding the distinction is vital for scaling systems without introducing unnecessary complexity.
🧩 Understanding the Class Diagram Foundation
The Class Diagram remains the backbone of object-oriented design. It is the standard representation for the static structure of a system. For a technical lead, this diagram answers fundamental questions about the domain model.
🔍 What Does It Represent?
A Class Diagram maps out the following:
- Classes: The blueprints for objects.
- Attributes: Data held within the class.
- Operations: Methods or functions available.
- Relationships: Associations, aggregations, compositions, and generalizations (inheritance).
This diagram is excellent for high-level domain modeling. It shows how entities relate to one another from the outside in. For example, a Customer class might be associated with an Order class. It defines the contract of interaction between these entities.
⚠️ Limitations in Complex Systems
As systems grow, the Class Diagram becomes insufficient for describing internal complexity. It treats a class as a black box. You know what it contains (attributes) and what it does (operations), but you do not see how those operations are implemented internally using other components.
Consider a PaymentProcessor class. The Class Diagram shows methods like charge() and refund(). It does not show that this class internally relies on a GatewayAdapter, a Logger, and a TransactionValidator to function. If you need to explain the internal wiring to a new engineer, the Class Diagram falls short.
🛠️ Introducing the Composite Structure Diagram
The Composite Structure Diagram (CSD) addresses the internal complexity gap. It is designed to show the internal structure of a classifier. Instead of a single box, you see a container filled with parts, ports, and connectors.
🏗️ Core Components of a CSD
To build a robust Composite Structure Diagram, you need to understand its specific elements:
- Parts: Instances of classifiers that exist within the composite structure. These are the building blocks.
- Ports: Interaction points where parts connect to the outside world or to other parts. They define the interface for communication.
- Connectors: Links between ports that define the flow of data or control.
- Interfaces: The contract a part exposes or requires.
This diagram shifts the perspective from “What does this object do?” to “How is this object built?” It is essentially a structural blueprint of a single class or component.
🧱 Visualizing Internal Logic
When a technical lead reviews a Composite Structure Diagram, they are looking at the internal topology. It reveals:
- Which sub-components are mandatory versus optional.
- How data flows between internal modules.
- Where dependencies exist that could cause tight coupling.
- How responsibilities are distributed within a single unit.
This level of detail is crucial when refactoring legacy code or designing high-performance systems where internal bottlenecks matter.
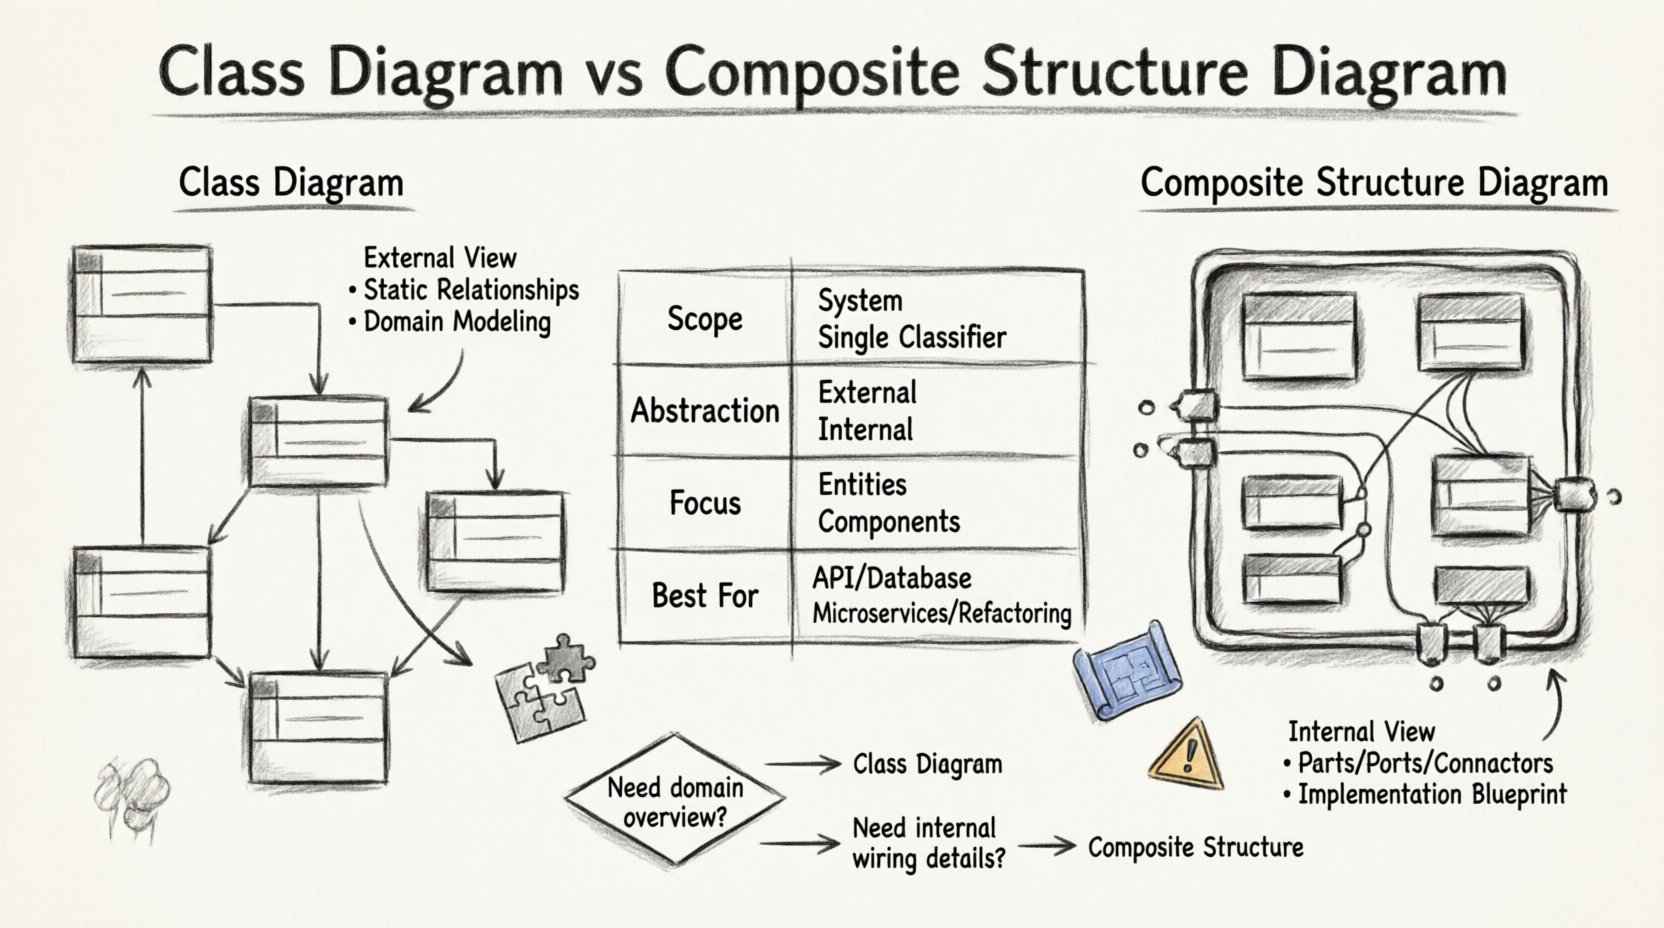
📊 Key Differences at a Glance
Choosing between these diagrams depends on the goal of the documentation. The table below outlines the technical distinctions.
| Feature | Class Diagram | Composite Structure Diagram |
|---|---|---|
| Scope | Entire system or subsystem | Internal structure of a single classifier |
| Abstraction Level | External behavior & relationships | Internal implementation details |
| Focus | Domain entities & types | Parts, Ports, & Connectors |
| Best Used For | Database schema, API contracts | Microservices internals, Plugin architectures |
| Complexity | High if system is large | High if internal logic is dense |
🚦 When to Use Which: A Decision Framework
Technical leads often face pressure to document everything. However, documentation should serve a purpose. Using the wrong diagram creates noise rather than clarity.
✅ Use Class Diagrams When:
- Defining the Domain Model: You need to establish the vocabulary of the system (e.g., Users, Products, Orders).
- Database Design: Mapping entities to tables or schemas requires static relationship mapping.
- API Specification: Defining the input and output signatures of services without revealing internal logic.
- Onboarding: New developers need to understand how major entities relate to each other.
✅ Use Composite Structure Diagrams When:
- Refactoring: You are breaking a monolithic class into smaller, manageable parts and need to visualize the wiring.
- Component Architecture: You are designing a system where internal components interact via specific ports (e.g., adapters, decorators).
- Dependency Injection: You need to show how dependencies are injected into a class at runtime.
- Complex Algorithms: A single class handles a complex workflow involving multiple internal steps that need isolation.
⚙️ Implementation Details: Parts, Roles, and Connectors
To effectively utilize Composite Structure Diagrams, technical leads must understand the mechanics of the UML specification. This ensures the diagrams are actionable rather than decorative.
🔗 Parts and Roles
A Part is a classifier that is owned by the composite structure. It is not just a reference; it is a component of the whole. However, a part is often defined by a Role.
For example, a Server composite structure might contain a RequestHandler part. The Server defines the role that the RequestHandler plays. This allows the same class to be used in different roles within different parts of the system.
🔌 Ports and Interfaces
Ports are the boundaries of the composite structure. They control the interaction.
- Provided Interface: The functionality the composite structure offers to the outside.
- Required Interface: The functionality the composite structure needs from the outside.
By defining ports, you enforce encapsulation. External code interacts with the port, not the internal parts directly. This reduces coupling and makes the system more resilient to change.
🔗 Connectors
Connectors link ports to other ports or to the outside world. They define the message flow. In a diagram, this looks like a line connecting two circles (ports). This visualization helps identify circular dependencies or single points of failure within a component.
🛡️ Common Pitfalls for Technical Leads
Even experienced engineers stumble when modeling. Avoid these common traps to maintain diagram integrity.
❌ Over-Modeling Internal Logic
Do not draw a Composite Structure Diagram for every single class. If a class is simple, a Class Diagram is sufficient. Only use CSD when the internal complexity justifies the overhead.
❌ Mixing Abstraction Levels
Do not mix Class Diagram relationships with Composite Structure internals in the same view. Keep the external view (Class) separate from the internal view (Composite). Mixing them confuses the reader about what is a dependency and what is an internal part.
❌ Ignoring Lifecycle Management
Parts in a Composite Structure Diagram have lifecycles. Are they created with the composite, or independently? If a part is destroyed when the composite is destroyed, this is a strict composition. If it survives, it is an aggregation. Failing to model this leads to memory leak risks in implementation.
❌ Assuming Static Implementation
Diagrams represent design, not necessarily runtime. A Connection between parts in a CSD might be a method call, a message queue, or a shared memory block. The diagram does not specify the transport mechanism. Leads must communicate this to the engineering team to avoid assumptions.
🔄 Maintenance and Evolution of Models
Documentation decays quickly if not maintained. Technical leads must establish a culture where diagrams evolve with the code.
📝 Keeping Diagrams in Sync
Use automated tools where possible to generate diagrams from code annotations. This reduces the burden on engineers. However, do not rely solely on generation. Manual reviews are necessary to ensure the diagram reflects the architectural intent, not just the current state.
🧹 Refactoring the Diagrams
When refactoring code, update the diagrams first. If the Class Diagram is updated before the code, the team has a clear target. If the CSD is updated, the internal boundaries are redefined before the code changes, preventing accidental coupling.
👥 Team Alignment
Use these diagrams in design reviews. When a lead presents a Composite Structure Diagram, they are inviting scrutiny on the internal cohesion. Encourage questions about ports and interfaces. This fosters a culture of rigorous design.
🌐 Integration with Other Models
Diagrams do not exist in a vacuum. They are part of a larger ecosystem of documentation.
🔗 Sequence Diagrams
Use a Sequence Diagram to show the dynamic flow of messages between objects. Use a Composite Structure Diagram to show the static parts that handle those messages. Together, they provide a complete picture of behavior and structure.
🔗 Deployment Diagrams
Deployment Diagrams show where software runs (servers, nodes). Composite Structure Diagrams show how the software is built internally. If you are designing a distributed system, the CSD helps you decide which parts should be deployed as separate services.
🔗 State Machine Diagrams
State Machine Diagrams describe behavior over time. A Class Diagram describes the data. A Composite Structure Diagram describes the composition. Using them together ensures that the logic, data, and structure are aligned.
📈 Impact on System Performance
While diagrams are abstract, they have real-world performance implications.
- Coupling: A Class Diagram showing many direct associations might indicate high coupling. A Composite Structure Diagram showing internal parts communicating via ports suggests a decoupled architecture.
- Memory: Composition implies ownership. If parts are heavy objects, the Composite Structure Diagram helps estimate memory footprint.
- Concurrency: Ports can define thread safety. If multiple parts access a shared resource, the diagram highlights potential race conditions.
By analyzing the structure before coding, leads can prevent performance bottlenecks that are expensive to fix later.
🎯 Final Thoughts on Modeling Strategy
The choice between a Class Diagram and a Composite Structure Diagram is not about which is better. It is about which is appropriate for the current context.
- Use Class Diagrams for the map of the territory.
- Use Composite Structure Diagrams for the blueprint of the buildings.
Technical leads who master this distinction can communicate complex architectures with precision. They ensure that teams understand not just what the system does, but how it is constructed. This clarity reduces friction, accelerates onboarding, and improves the long-term health of the codebase.
Invest time in selecting the right model. Document the internal logic where it adds value. Avoid over-documentation where it adds noise. Maintain these artifacts as living documents. By doing so, you build a foundation for scalable, maintainable, and robust software engineering practices.