


Designing complex software systems requires more than just listing classes and functions. It demands a clear understanding of how those components fit together physically and logically. This is where the Composite Structure Diagram becomes an essential tool for architects and developers. It provides a view into the internal structure of classifiers, revealing the parts, roles, and connections that make up a system’s core logic.
Whether you are mapping out a microservices architecture or defining the internals of a complex object, understanding this diagram type ensures clarity and reduces technical debt. This guide explores the anatomy, creation, and application of Composite Structure Diagrams without the fluff. We will move from the initial concept to a detailed blueprint.
What is a Composite Structure Diagram? 🤔
A Composite Structure Diagram is a type of UML (Unified Modeling Language) diagram. It focuses on the internal structure of a classifier. While a Class Diagram shows the external relationships between classes, a Composite Structure Diagram looks inside the class to show how its internal parts interact.
It is particularly useful for:
- Visualizing the physical deployment of software components.
- Defining the internal architecture of a complex class.
- Specifying how parts collaborate to fulfill the responsibilities of a classifier.
- Documenting delegation mechanisms where one part forwards requests to another.
Think of it as an X-ray for your code. It shows the skeleton and the nervous system inside the box.
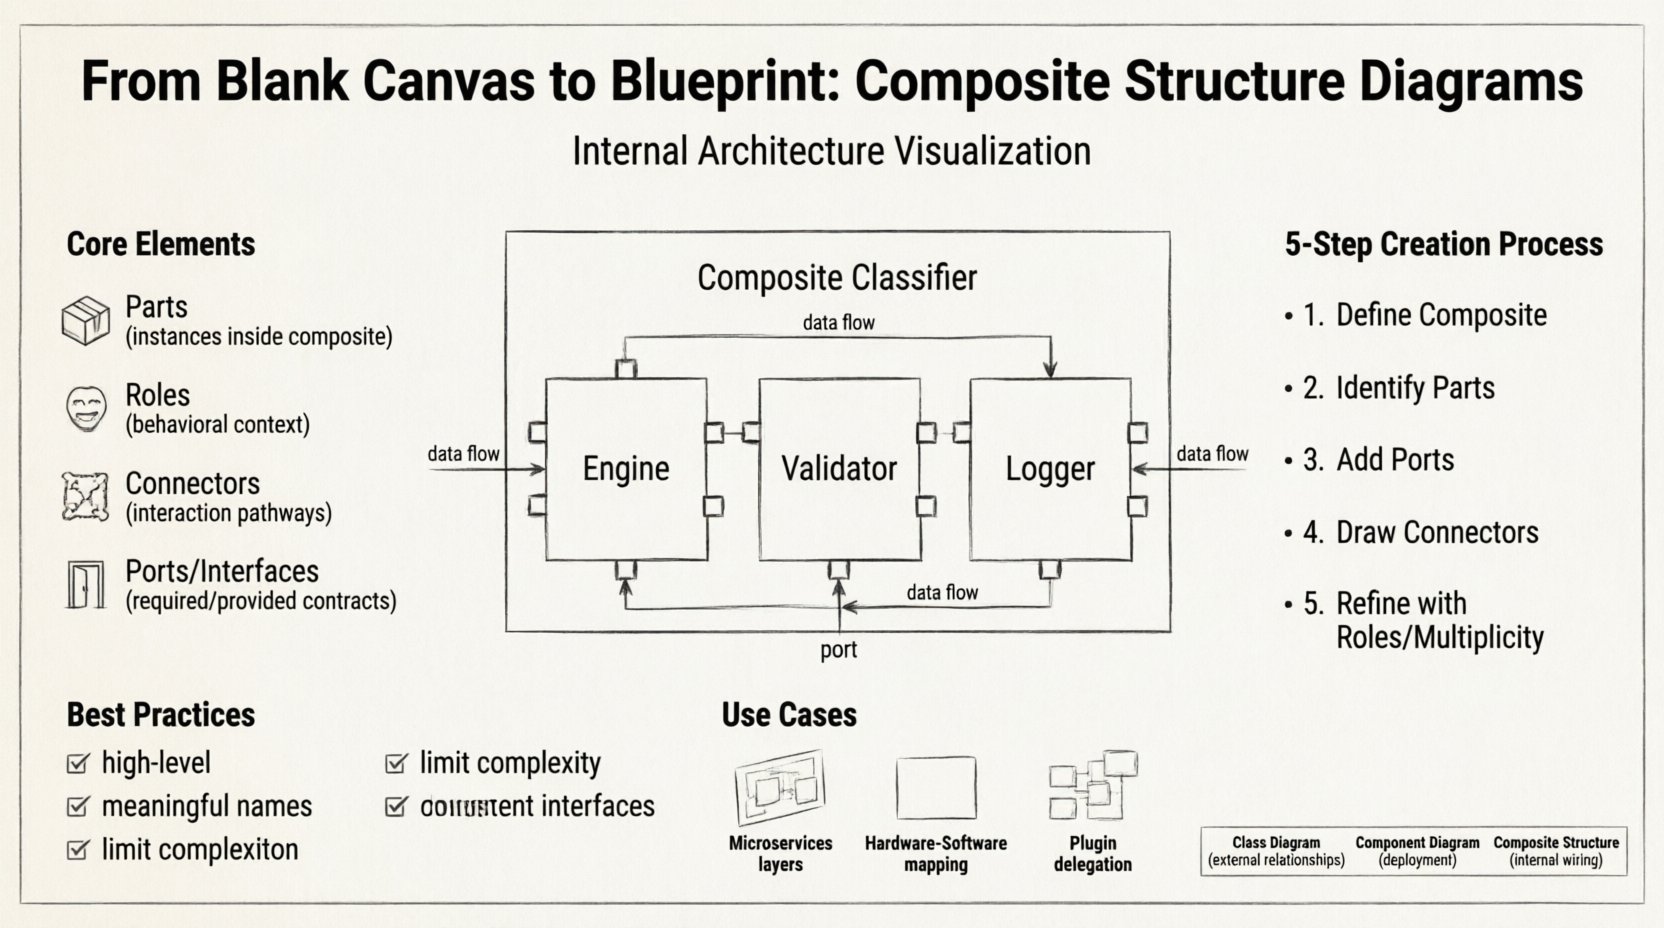
Core Elements of Composite Structure Diagrams 🧩
To build a valid diagram, you must understand the fundamental building blocks. Each element serves a specific purpose in defining the structure.
1. Parts 📦
Parts represent the internal components that make up a composite classifier. They are essentially instances of other classifiers living inside the main structure. A part has a specific type and a specific name within the composite.
- Example: Inside a
Carstructure, you might have aEnginepart, aWheelpart, and aTransmissionpart. - Parts can be shared or owned. Ownership implies the part cannot exist independently of the composite.
2. Roles 🎭
Roles define how a part behaves within the context of the composite structure. A single part type can play multiple roles. This abstraction allows you to treat the same underlying component differently depending on where it is used in the structure.
- Example: A
NetworkInterfacepart might play the role ofInputPortwhen receiving data andOutputPortwhen sending data.
3. Connectors 🔗
Connectors define the interactions between parts. They represent the pathways through which data flows. Connectors are typed, meaning they specify the kind of interaction allowed (e.g., data flow, control flow).
- They link the interaction points of one part to the interaction points of another.
- They can be internal (within the composite) or external (connecting the composite to the outside world).
4. Interfaces and Ports 🚪
Ports are the interaction points on a part. They are where connections are made. Interfaces define the contract that a port must satisfy.
- Required Interface: The part needs this service to function.
- Provided Interface: The part offers this service to others.
Visual Syntax and Notation 📐
Understanding how to draw the diagram is just as important as understanding the concepts. The notation is standardized to ensure that any developer can read the blueprint.
- Composite Classifier: Represented by a rectangle divided into two sections. The top section contains the name of the composite. The bottom section lists the internal parts.
- Parts: Listed inside the bottom section of the composite rectangle. They are often labeled with their type and a unique instance name.
- Connectors: Lines drawn between parts. They may have labels indicating the role or interface type.
- Ports: Small rectangles attached to the side of the part, or sometimes implied by the connector lines.
The visual hierarchy is critical. If a part is inside the rectangle, it is internal. If it is outside, it is external context.
Step-by-Step: Creating a Composite Structure Diagram 🛠️
Creating a diagram from a blank canvas requires a methodical approach. Follow these steps to ensure accuracy and completeness.
Step 1: Define the Composite Classifier
Start by identifying the system or class you are decomposing. Draw a large rectangle. Label the top section with the name of the composite (e.g., OrderProcessingSystem). This is your container.
Step 2: Identify Internal Parts
Analyze the responsibilities of the composite. What sub-components are absolutely necessary to perform these responsibilities? Draw smaller rectangles inside the main container. Label them as parts.
- Strategy: Ask, “What does this system contain?” rather than “What does this system do?”
- Detail: Assign instance names to parts (e.g.,
validator : ValidationService).
Step 3: Define Interaction Points (Ports)
For each part, determine where it connects. Does it need input? Does it provide output? Add ports to the parts where necessary. Label the ports with the interface they implement.
Step 4: Draw Connectors
Connect the ports of the parts. Use lines to show the flow of data or control. Ensure that every required interface has a matching provided interface connection within the structure.
- Check: Are all dependencies satisfied?
- Check: Are there any circular dependencies that create confusion?
Step 5: Add Roles and Multiplicity
Refine the diagram by adding role names on the connectors. If a part can have multiple instances, specify the multiplicity (e.g., 0..1, 1..*). This adds precision to the architectural definition.
Structural Relationships Explained 🔍
Understanding the relationships between parts is the key to effective modeling. There are two primary ways parts relate to each other.
Delegation
Delegation is a mechanism where the composite forwards a request from an external client to an internal part. This allows the composite to hide the complexity of its internals.
- The composite acts as a proxy.
- External calls hit the composite, which routes them to the correct part.
- This reduces coupling between the client and the internal implementation.
Collaboration
Collaboration involves parts working together to achieve a goal. This is common in data processing pipelines where one part transforms data for the next.
- Data flows from Part A to Part B to Part C.
- Each part has a specific function within the chain.
- Connectors represent the data streams between them.
Comparison: Composite vs. Class vs. Component 📊
Confusion often arises between these three diagram types. Here is a clear breakdown to help you choose the right tool for the job.
| Diagram Type | Primary Focus | Best Used For |
|---|---|---|
| Class Diagram | Static structure of software | Defining attributes, methods, and relationships between classes. |
| Component Diagram | Physical architecture | Showing deployable artifacts and their high-level dependencies. |
| Composite Structure Diagram | Internal structure of a classifier | Showing how parts, roles, and connectors work inside a specific class or system. |
Use a Class Diagram for the broad picture of your database schema or object model. Use a Component Diagram for deployment topology. Use a Composite Structure Diagram when you need to explain the internal wiring of a complex object.
Best Practices for Modeling 🏆
To keep your documentation clean and useful, adhere to these guidelines.
- Keep it High-Level: Do not try to model every single variable. Focus on the structural components that drive behavior.
- Use Meaningful Names: Avoid generic names like
Part1. UseCacheManagerorLoggerServiceso the diagram is self-documenting. - Limit Complexity: If a diagram becomes too crowded, split it into multiple diagrams. One composite structure diagram should ideally fit on one screen without scrolling.
- Consistent Notation: Stick to standard UML symbols. Do not invent custom shapes unless absolutely necessary for a specific tool.
- Document Interfaces: Clearly mark what is provided and what is required. This prevents integration errors later.
Common Mistakes to Avoid ⚠️
Even experienced modelers make errors. Being aware of these pitfalls can save you time during reviews.
- Over-Modeling: Trying to draw the entire system in one composite structure diagram. This leads to spaghetti diagrams that no one can read.
- Ignoring Multiplicity: Failing to specify how many parts exist (e.g., one engine vs. multiple wheels). This leads to ambiguity in implementation.
- Mixing Levels: Combining logical components with physical deployment details. Keep the structure logical; use deployment diagrams for physical details.
- Missing Ports: Drawing connectors without defining ports. Connectors need specific entry and exit points to be valid.
- Ignoring Lifecycle: Not specifying if parts are created and destroyed with the composite. This affects memory management and resource allocation.
Use Cases in Modern Architecture 🚀
While often associated with traditional object-oriented design, composite structure diagrams have evolved to fit modern contexts.
Microservices Internal Design
Even in microservices, individual services can be complex. A composite structure diagram can show how a service is built from internal modules, such as an API Gateway, a Business Logic Layer, and a Data Access Layer.
Hardware-Software Co-Design
When software interacts with hardware, composite structure diagrams help map software parts to hardware pins or drivers. This is crucial for embedded systems.
Plugin Architectures
Applications that support plugins use composite structures to show how the core application delegates tasks to external modules. This clarifies the extension points.
Maintenance and Evolution 🔄
A diagram is not a one-time task. Systems evolve, and so must your documentation.
- Version Control: Treat your diagrams like code. Store them in version control systems to track changes over time.
- Code Synchronization: Ensure the diagram matches the actual code. If the code changes, update the diagram. Outdated diagrams are more confusing than no diagrams.
- Review Cycles: Include diagram reviews in your sprint planning. Ask developers if the structure still reflects reality.
- Refactoring: If you refactor a class, the composite structure likely needs adjustment. Use the diagram to plan the refactoring impact.
Tools and Implementation Tips 🛠️
While specific software is not the focus, the principles of implementation remain the same across platforms.
- Drag and Drop: Use tools that allow easy manipulation of parts and connectors.
- Auto-Layout: Some tools offer automatic arrangement. While helpful, manual tweaking is often needed for clarity.
- Export Options: Ensure you can export the diagram to PDF or image formats for stakeholder presentations.
- Linking: If possible, link diagram elements to code repositories. This adds traceability.
Summary of Benefits 💡
Why invest the time in creating these diagrams? The return on investment is significant for complex systems.
- Clarity: It removes ambiguity about internal workings.
- Communication: It provides a visual language for architects and developers to discuss design.
- Validation: It helps identify missing connections or unimplemented interfaces early.
- Onboarding: New team members can understand the system structure faster.
- Decoupling: It encourages designing interfaces that hide implementation details.
By mastering the internal structure of your classifiers, you build systems that are easier to maintain and extend. The effort spent on the blueprint pays off during the construction and renovation phases of the software lifecycle.