


Ever wish you could quickly turn your business goals into a clear, data-driven action plan? The AI-Powered Benchmarking Analysis Tool from Visual Paradigm makes it possible in minutes. This online tool guides you through a structured process to compare your business’s performance against competitors, helping you identify gaps and build a solid improvement strategy. The best part? You can use AI to generate a complete analysis framework with just a few details about your business. Let’s see how it works, using a real-world example of a global coffeehouse chain.
Imagine you’re a strategist at a major coffee company. You need to understand how your performance stacks up against rivals like Dunkin’ and McCafé. The traditional way would mean hours of research, data gathering, and manual analysis. But with this tool, you can start with a clean slate and let AI do the heavy lifting. The process is designed to be intuitive, taking you step-by-step from defining your goals to creating a professional report.
Quick Summary: How the AI Tool Works
-
Step 1: Define Objectives – Set high-level goals like enhancing customer experience or increasing sales.
-
Step 2: Identify Metrics – Choose specific performance indicators (e.g., average transaction value, customer satisfaction) and select your competitors to compare against.
-
Step 3: Collect & Analyze Data – Input your current performance and the competitor’s data to see the gaps.
-
Step 4: Develop Improvement Plan – Create actionable strategies to close the performance gaps.
-
Step 5: Final Report – Generate a professional document to share with your team and leadership.
Let’s walk through the process with the example of a global coffeehouse chain, using the provided images as a guide.
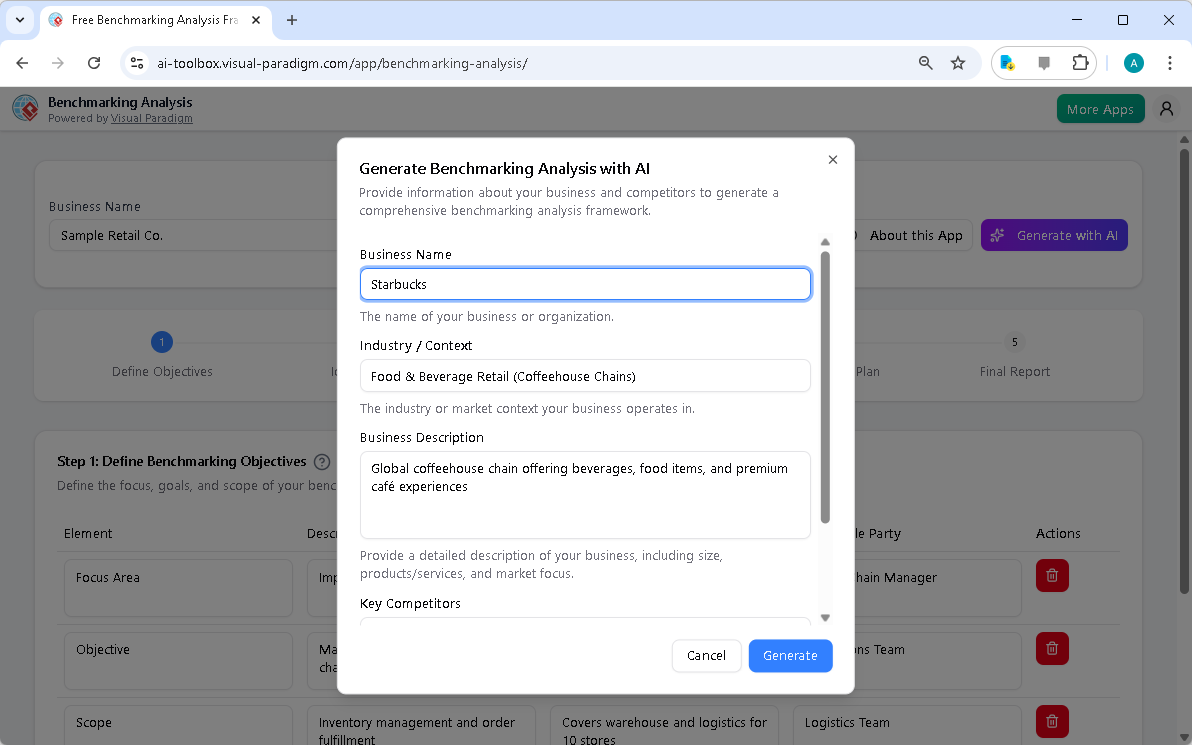
First, you start by giving the AI a little context. In the image above, you see the initial screen where you input your business name, industry, and a brief description. For our coffeehouse example, you’d enter “Starbucks,” “Food & Beverage Retail (Coffeehouse Chains),” and a description like “Global coffeehouse chain offering beverages, food items, and premium café experiences.” You’d also list your key competitors. This information is crucial because it tells the AI what kind of analysis to generate. Once you’re ready, you hit the “Generate with AI” button, and the tool does the work of populating the first few steps.
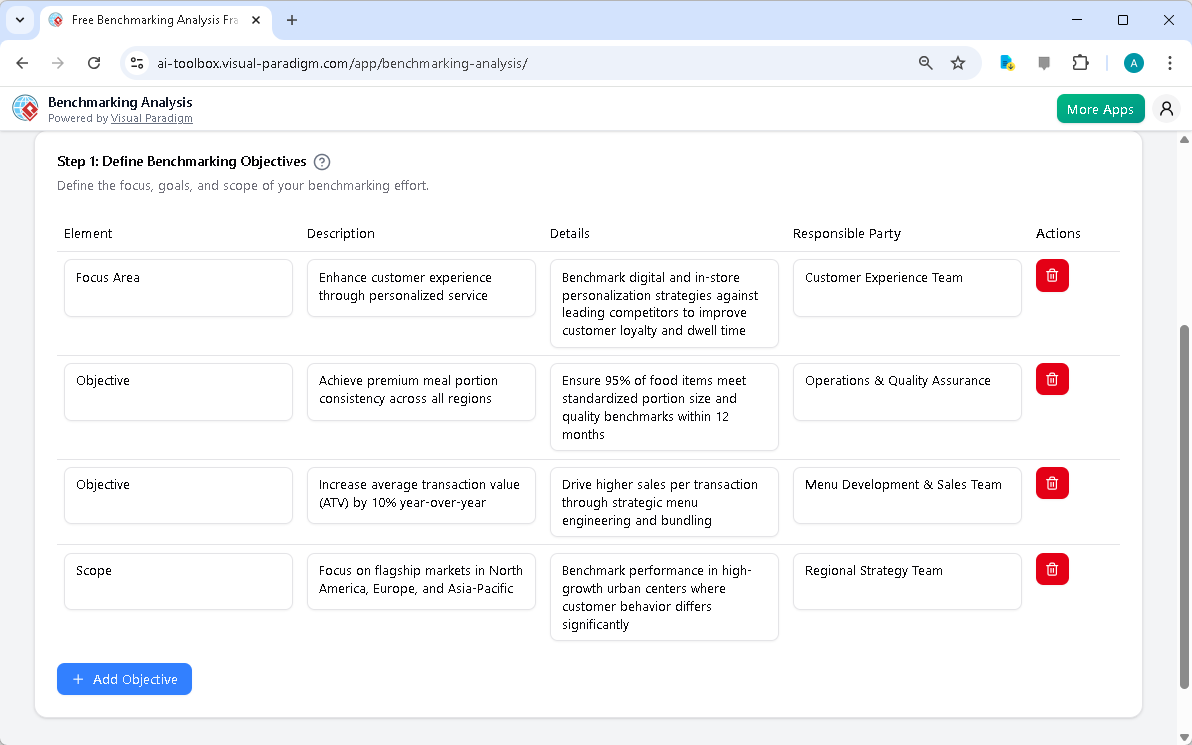
After the AI generates the initial data, you move to Step 1: Define Benchmarking Objectives. Here, the tool has already populated a table with a few suggested objectives. For a coffee chain, these might include enhancing the customer experience through personalized service, achieving premium meal portion consistency, or increasing the average transaction value. Each objective has a description and a responsible party assigned. You can easily edit these suggestions or add more objectives using the “Add Objective” button. This step forces you to think clearly about your goals and who will be accountable for them.
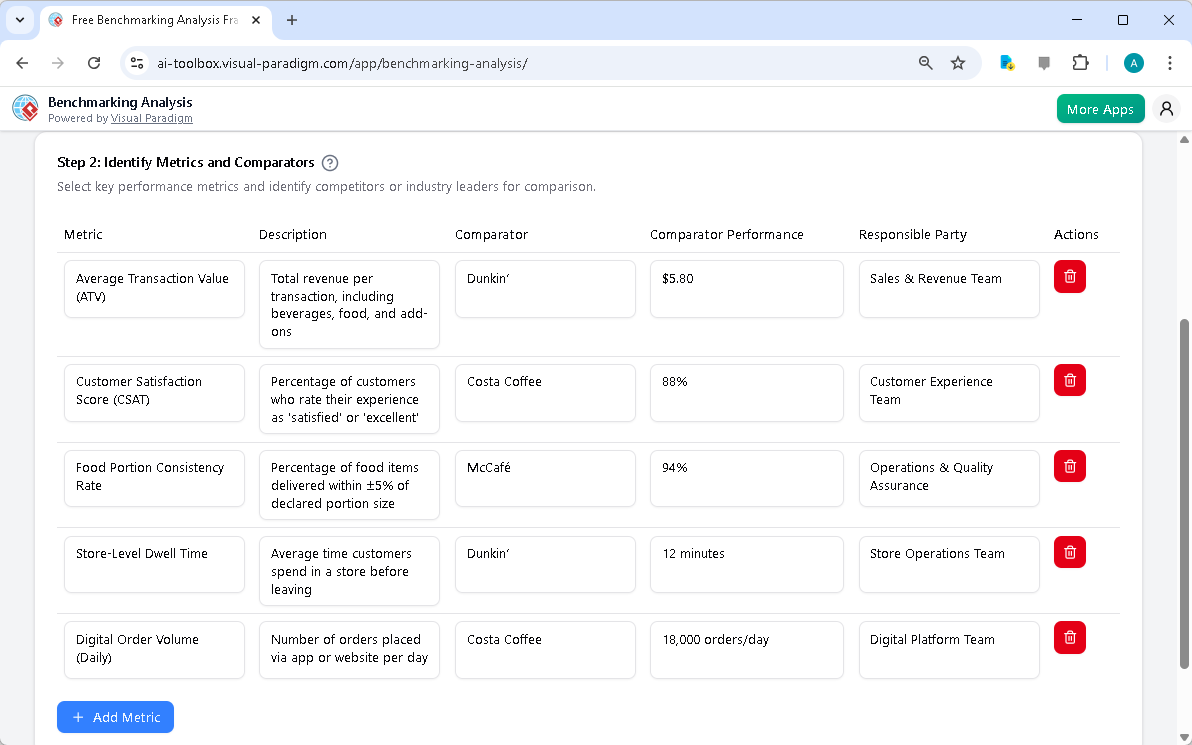
Next, you proceed to Step 2: Identify Metrics and Comparators. The tool now asks you to define the specific metrics you’ll use to measure performance. For our coffeehouse, this could be the Average Transaction Value (ATV), Customer Satisfaction Score (CSAT), Food Portion Consistency Rate, and Store-Level Dwell Time. The AI suggests specific competitors for each metric—like Dunkin’ for ATV and Costa Coffee for CSAT. You can easily edit these comparators to be your actual competitors. This step is all about making your analysis concrete and focused.
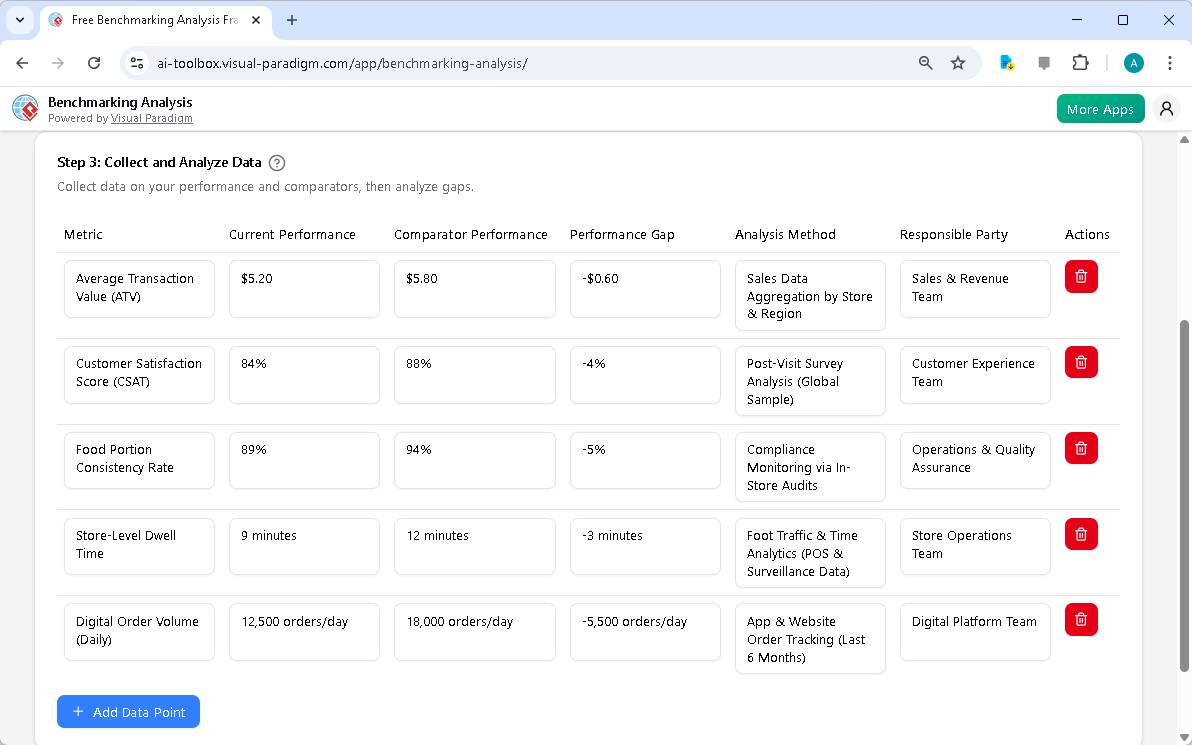
With your metrics and comparators defined, you move to Step 3: Collect and Analyze Data. This is where you input your actual performance numbers. For example, you might enter that your current ATV is $5.20, while your competitor Dunkin’ has an ATV of $5.80, creating a performance gap of -$0.60. The tool automatically calculates the gap for you. You can also add an “Analysis Method” to explain how you gathered the data (e.g., “Sales Data Aggregation by Store & Region”). This step turns your raw data into actionable insights, clearly showing where you’re falling short.
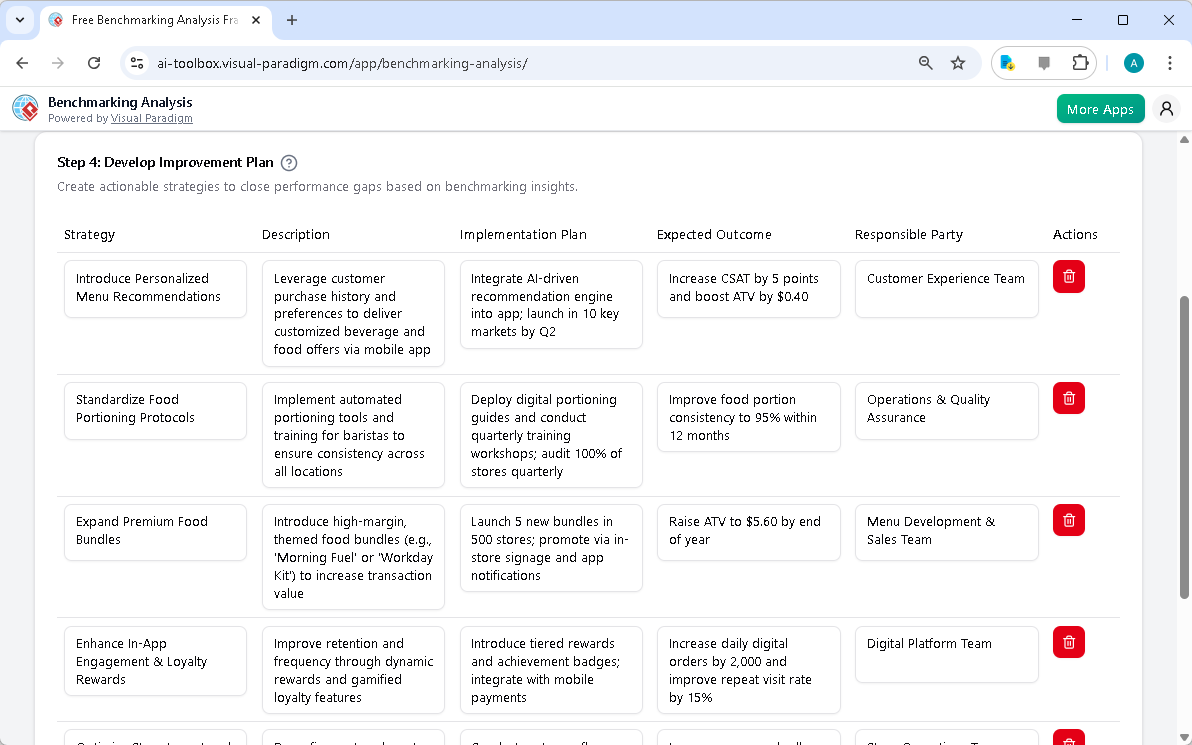
After analyzing the data, you move to Step 4: Develop Improvement Plan. The AI suggests strategies to close the performance gaps. For the ATV gap, it might suggest “Introduce Personalized Menu Recommendations.” For the food portion consistency gap, it might suggest “Standardize Food Portioning Protocols.” Each strategy has a description, an implementation plan, and an expected outcome. You can edit these suggestions or add your own strategies. This step is where your analysis becomes a roadmap for action.
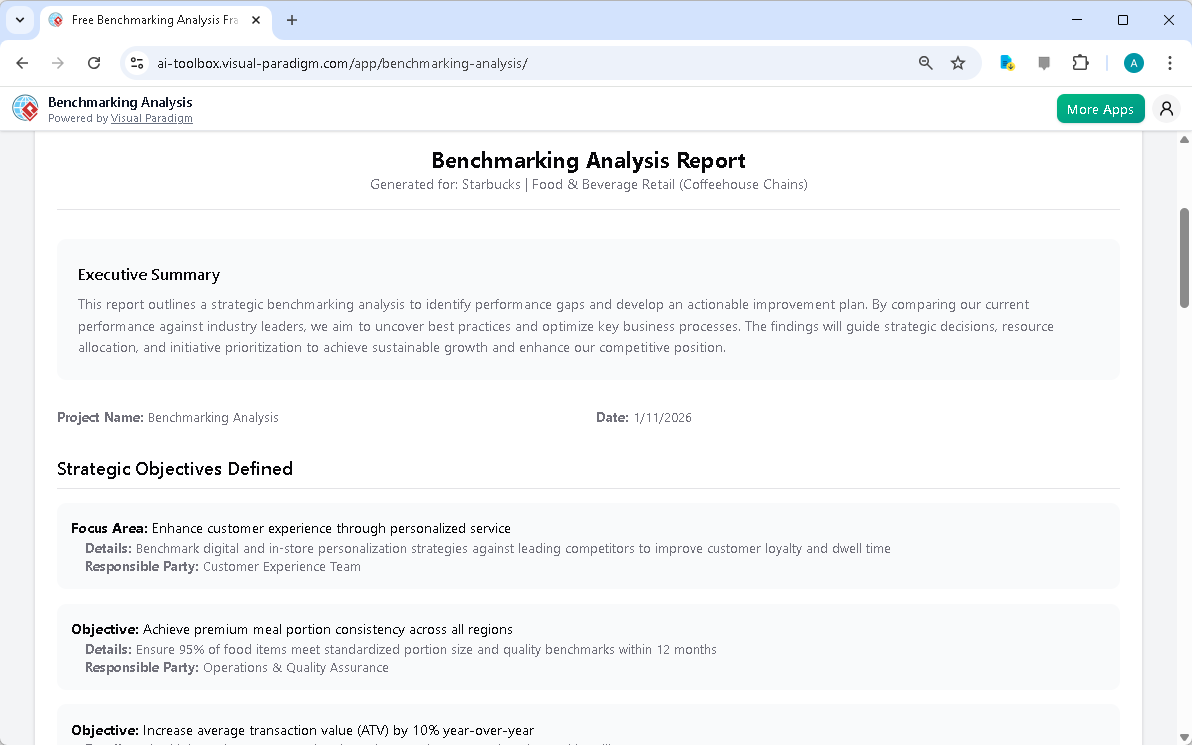
Finally, you reach Step 5: Final Report. The tool compiles all the information from the previous steps into a single, professional report. This report includes an executive summary, a list of strategic objectives, and the improvement plan. It’s the perfect document to share with your team, leadership, or stakeholders. You can print it directly from your browser or save it as a PDF. The entire process—from a blank canvas to a complete, shareable report—can be done in a matter of minutes, thanks to the AI-powered tool.
Using the AI-Powered Benchmarking Analysis Tool from Visual Paradigm is like having a strategic consultant on your team. It takes the complexity out of benchmarking, making it fast, structured, and accessible. Whether you’re a business strategist, operations manager, or marketing professional, this tool helps you make data-driven decisions and gain a competitive edge. It’s a powerful way to turn your business goals into a clear, actionable plan.
Related Resources
Ready to see how it can work for your business? Try the AI-Powered Benchmarking Analysis Tool now and start building your strategic roadmap in minutes.
-
Free Benchmarking Analysis Tool for Performance Comparison – Visual Paradigm Product Updates: September 9, 2025 – Measure your performance against competitors with our free benchmarking analysis tool. Identify strengths, weaknesses, and opportunities for improvement with AI-powered insights.
-
Visual Paradigm AI Guide: Architecture, Standards, and Benefits: A comprehensive guide to the Visual Paradigm AI Visual Modeling Platform. Explore its ArchiMate architecture, standardized UML support, and how it automates system design compared to generic LLMs.
-
Free Benchmarking Analysis Tool | Visual Paradigm Online: Identify performance gaps and discover best practices with free Visual Paradigm’s Benchmarking Tool. Compare against competitors and drive strategic growth. Learn more.
-
Visual Paradigm Review: AI-Powered Modeling & Design Tools: Explore our in-depth review of Visual Paradigm . Discover how its new Generative AI engine transforms UML modeling, agile management, and enterprise architecture.
-
Free Benchmarking Analysis Framework | Visual Paradigm Online: Start your benchmarking analysis . Define objectives, identify metrics, analyze performance gaps, and create your strategic improvement plan with our free interactive framework.
-
Benchmarking Analysis Framework – s.visual-paradigm.com: The Benchmarking Analysis Tool is designed to help organizations systematically compare their performance metrics against competitors or industry standards. It provides a structured framework to identify gaps, analyze root causes, and develop actionable strategies that drive continuous improvement.
-
Visual Paradigm AI Platform: A Comprehensive ArchiMate Guide: Explore the Visual Paradigm AI Visual Modeling Platform through the ArchiMate perspective. Learn how its standardized intelligence, persistent visual structures, and context-aware tools outperform generic LLMs.